EquiAnalytix Dashboard Guide
How to Read, Interpret and Apply Our Racing Data
Introduction
EquiAnalytix exists to give you an edge. Not tips, not hunches, not opinions dressed up as analysis. Data. The kind of data that separates informed decisions from guesswork.
This guide explains exactly how our platform works: every metric, every feature, every tool. Whether you're scanning the dashboard before a Saturday card, building a Placepot strategy for a festival, or hunting for market movers before the off, this is your complete reference.
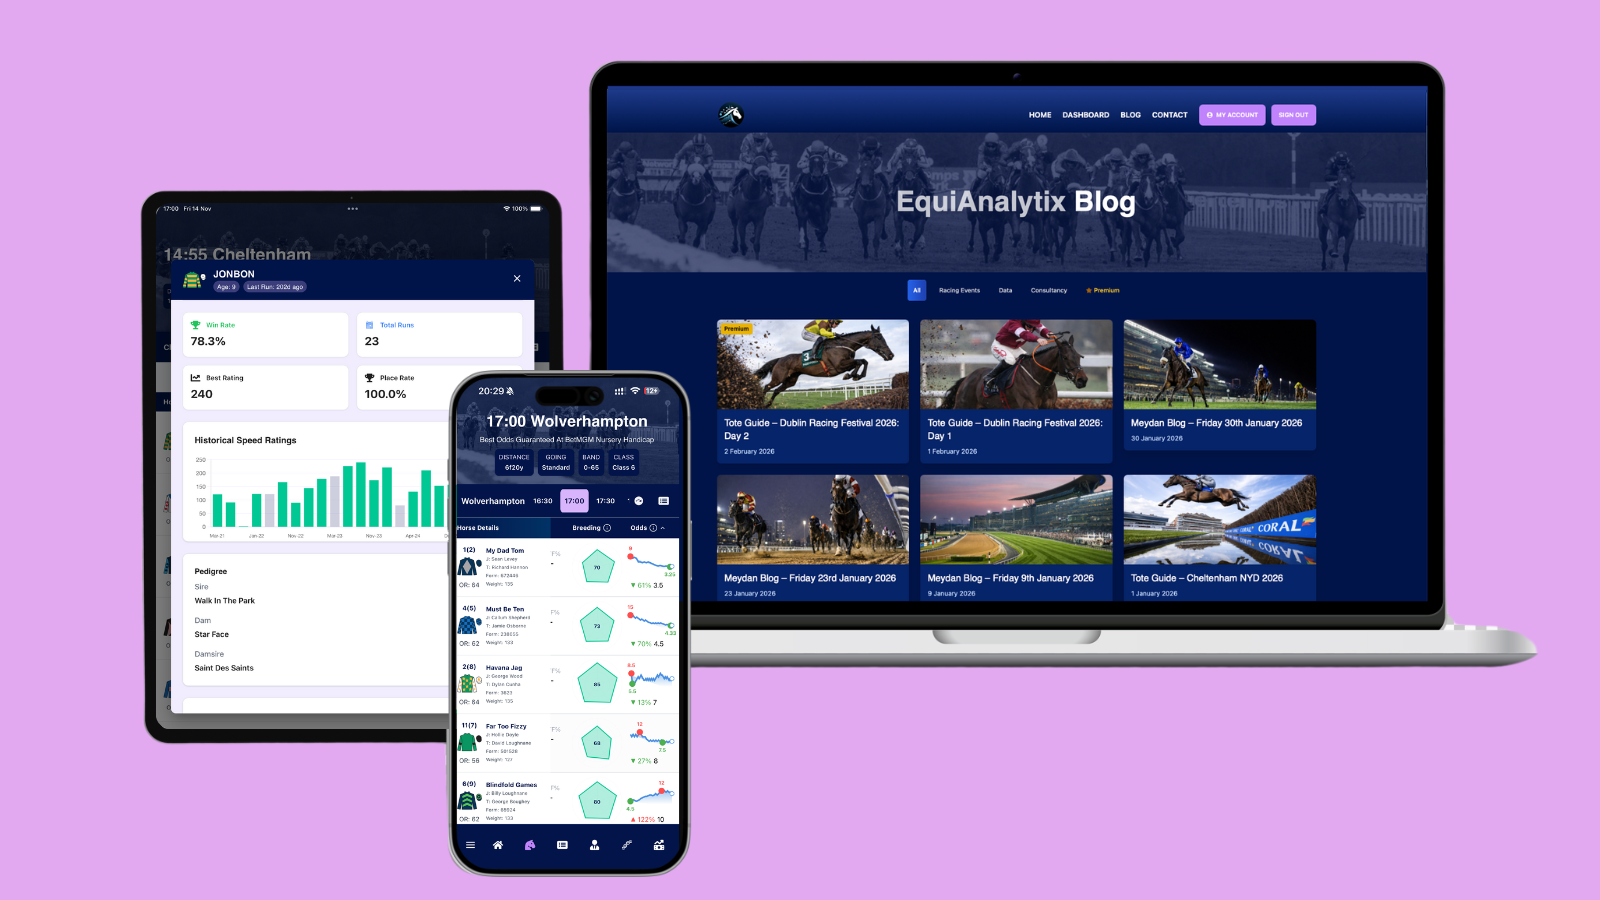
EquiAnalytix Dashboard Overview
Getting Started
What You See
When you log in, you land on the race calendar. This is your starting point for every session.
A horizontal row of date chips lets you navigate between racing days. Today's date is selected by default. Tap any date to see that day's fixtures.
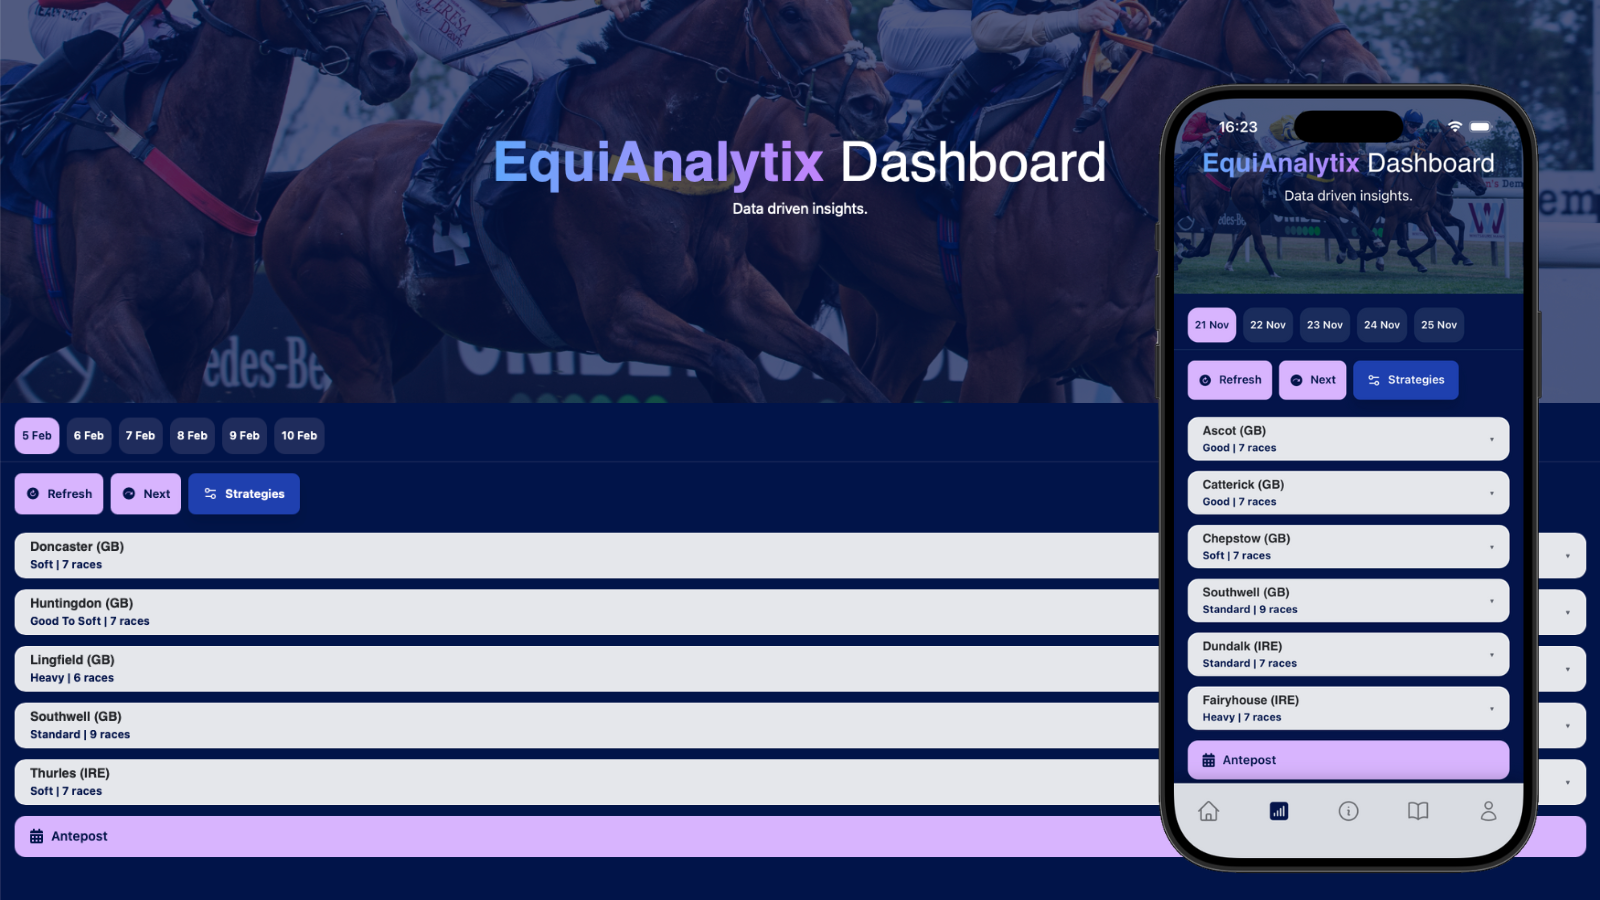
Landing Page - Race Calendar View
Quick Actions
Refresh
Forces a fresh data pull from our servers. Use this if you've had the app open for a while and want the latest odds and non-runner updates.
Next Race
Jumps directly to the next race due off. On today's card, this finds the soonest race after the current time.
Strategies
Opens the Strategy Builder (covered in Part 13).
Antepost
Takes you to the antepost section for major festival and championship markets.
The Dashboard Overview
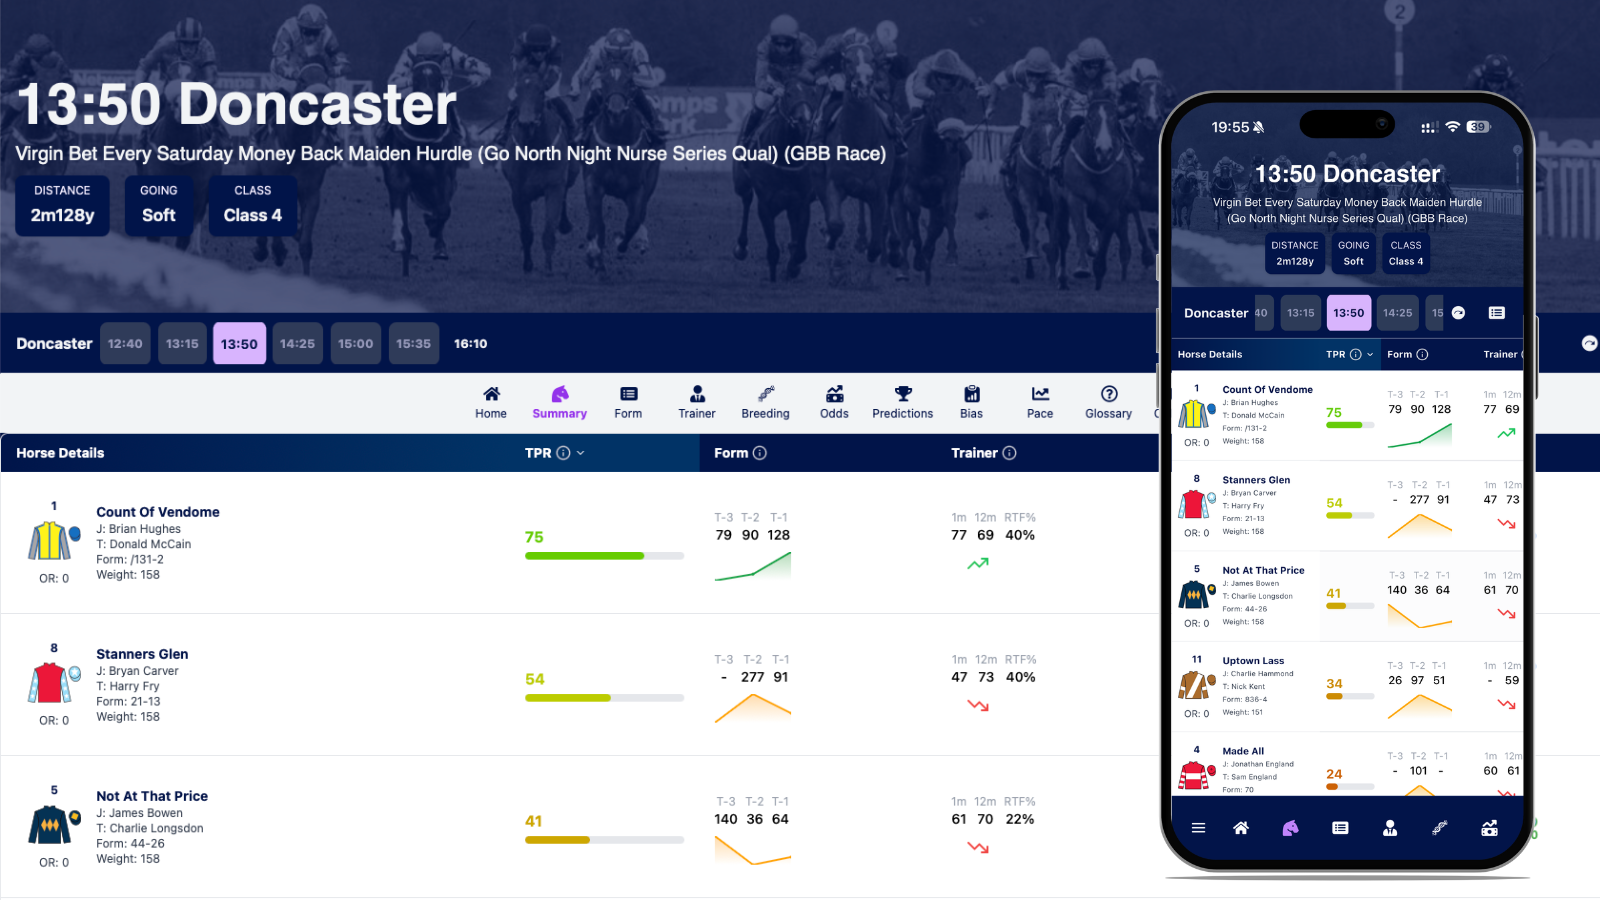
The Race Header
At the top of every race page, you'll see:
- Off time and course, e.g., "14:30 Cheltenham"
- Race name, the full title
- Key conditions, including Distance, Going, Rating Band, Race Class
Navigation Modules
The dashboard is organised into modules. Each focuses on a different angle:
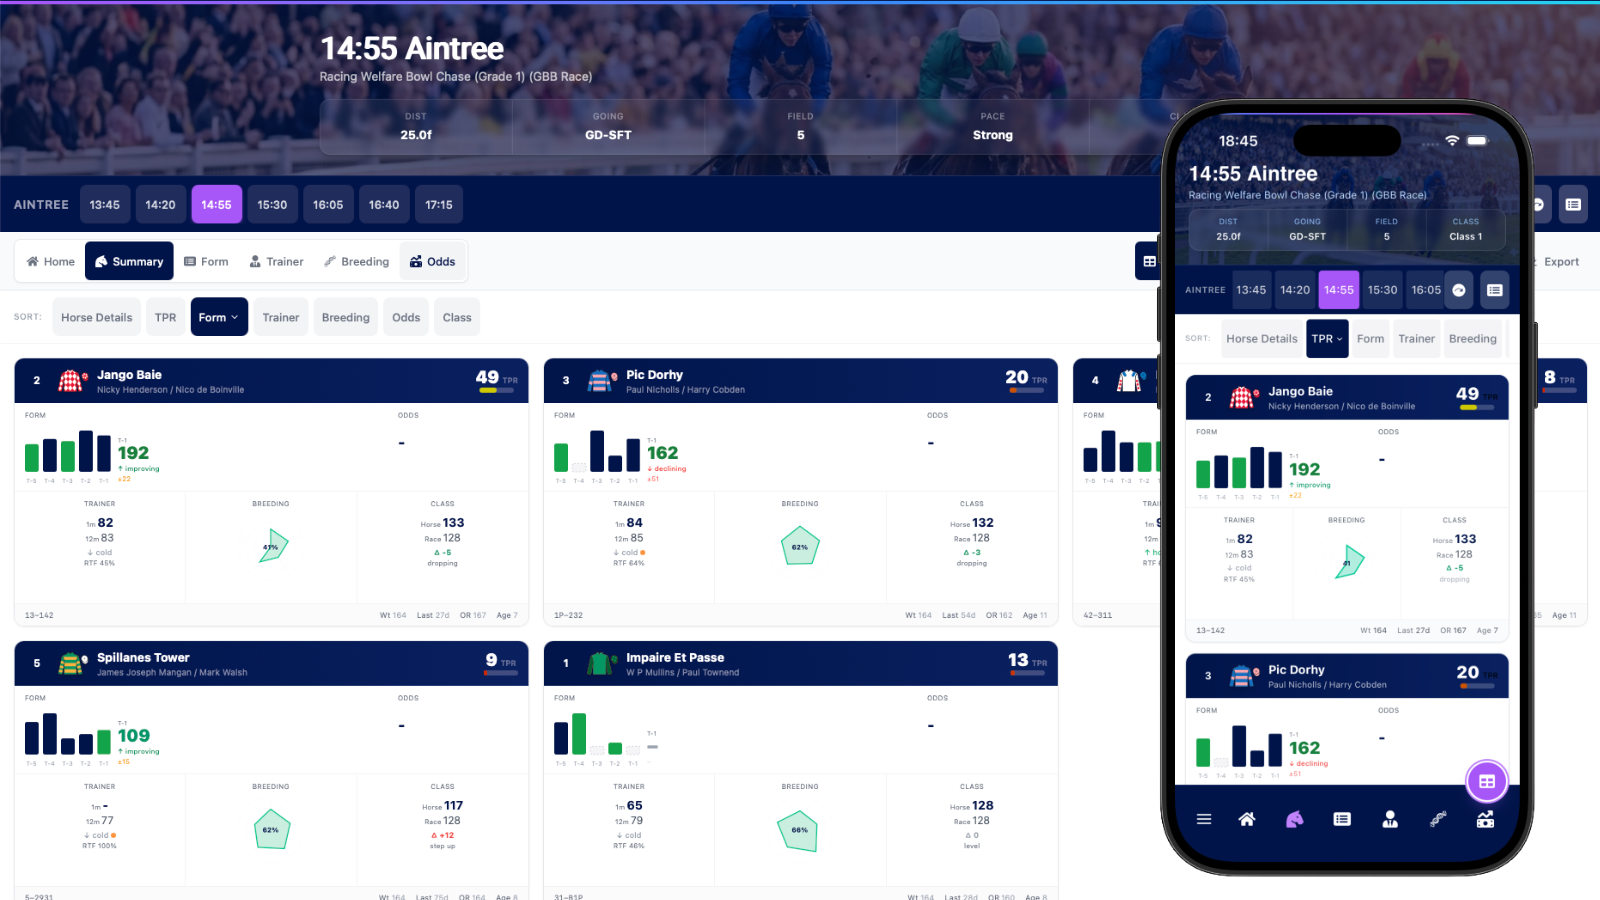
Summary Module
Essential view: TPR, recent form, trainer snapshot, breeding hexagon, odds
Dashboard Navigation Modules
Additional Tools
Beyond the main modules, you have access to:
Table View vs Card View
The dashboard offers two ways to view race data. Table View is the default — a traditional data table where each horse is a row and each metric is a column. This is ideal for comparing horses side by side and sorting by any column.
Card View displays each horse as an individual card with its own visual layout. This is particularly effective on mobile devices where horizontal scrolling in a table can be cumbersome, and when you want to scan through runners quickly with a clear visual hierarchy per horse.
How to Toggle
- Desktop: Click the Cards/Table button in the toolbar (top right, next to Predictions). The icon shows what you'll switch to.
- Mobile: Tap the floating circular button in the bottom-right corner (above the navigation bar). It has a purple ring and shows a grid or table icon.
Card View Features
- Sorting: A pill bar at the top of the card grid lets you sort by any metric — TPR, T-1, trainer form, class delta, and more. Same sort options as the table column headers.
- Module switching: Cards change their content based on the active module (Summary, Form, Trainer, Breeding, Odds) — just like the table changes columns.
- All interactions preserved: Tap a horse name to open the profile modal. Tap the breeding hexagon to compare horses. Tap the odds chart to open the odds history. Everything works identically to the table.
- Persists across races: Once you switch to card view, it stays on card view when you navigate to a new race. The default when you first open the dashboard is always table view.
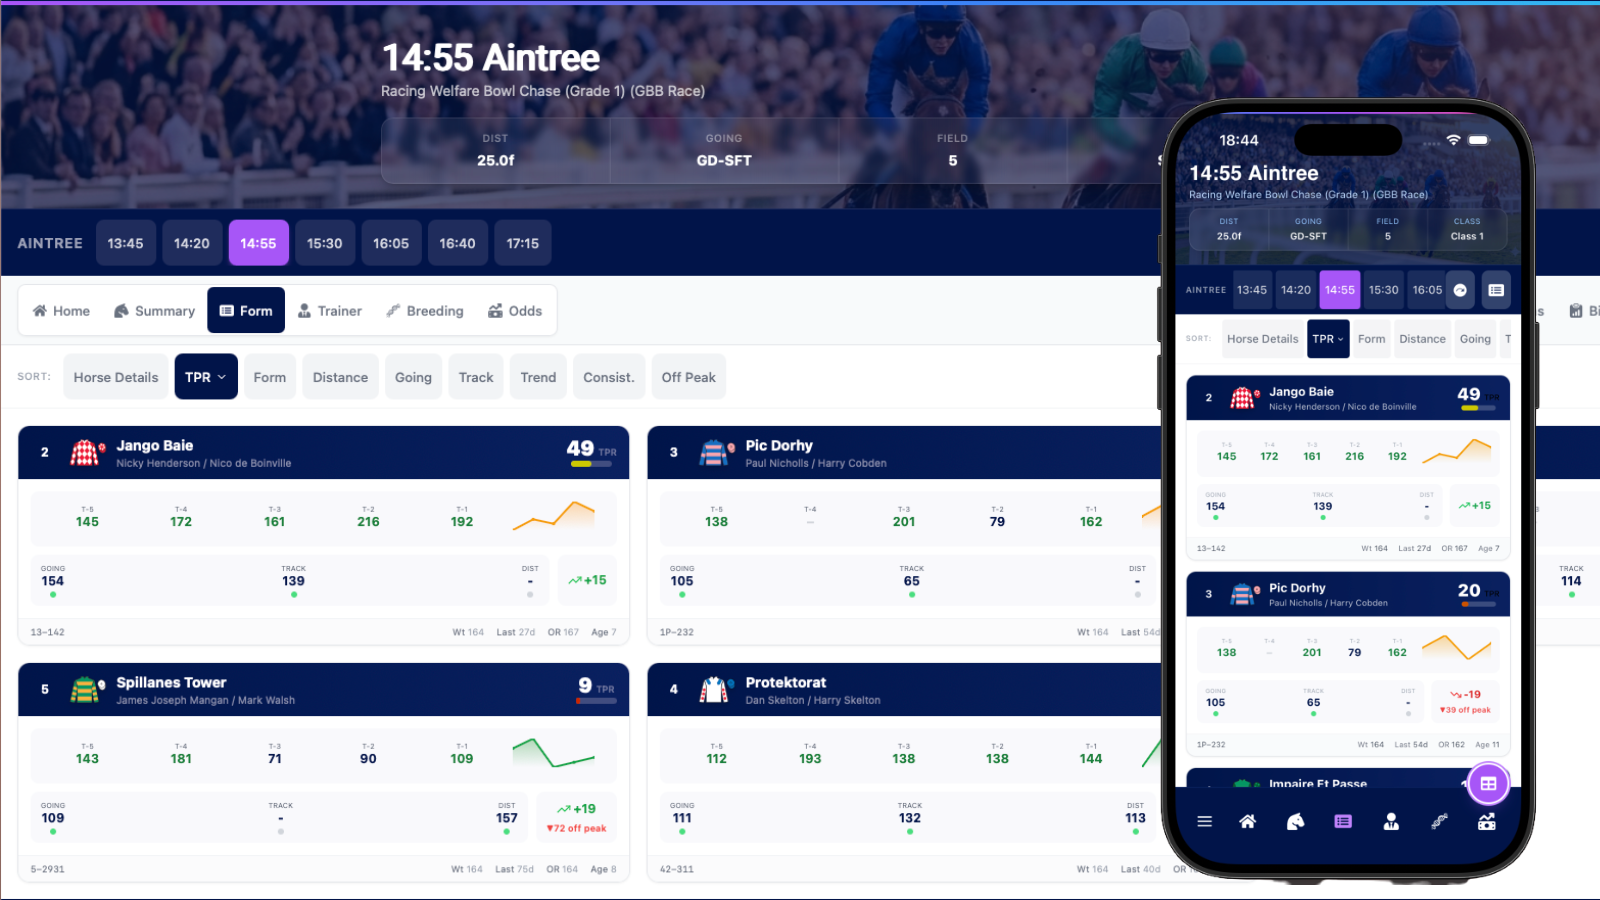
Card View showing the Summary module with form bars, odds chart, trainer, breeding, class, and handicap mark data per horse
Total Performance Rating (TPR)
What It Is
TPR is our headline metric. It's the number displayed prominently next to every horse, and it represents our model's assessment of that horse's likely performance level in today's race.
TPR is generated by machine learning. It synthesises everything on the dashboard (recent form, speed figures, trainer and jockey statistics, course and distance performance, going preferences, breeding data) into a single predictive number. It's not just "how good is this horse" but "how good is this horse likely to run today, given everything we know."
TPR Scale: 0-100
Why It Matters
We've backtested TPR across our entire database, over two decades of UK and Irish racing, hundreds of thousands of races. Here's what we found:
The Rank Matters More Than The Number
A TPR of 45 means nothing in isolation. What matters is whether that 45 makes the horse 1st, 2nd, 3rd, or 4th in the field. The statistics above are based on rank, not absolute values.
Don't get caught up in whether a TPR is "high" or "low". Focus on where it sits relative to the opposition. A horse with TPR 38 who leads by 15 points is in a stronger position than a horse with TPR 55 who's third in a tight field.
TPR Rating Display with Color Coding
How to Use It
Start with the top four
Always. Before you look at anything else, identify who the TPR model rates highest. These are your primary candidates.
Then stress-test
TPR is the starting point, not the ending point. Your job is to find reasons to confirm the favourite, upgrade a horse ranked 2nd to 4th, or downgrade the leader.
EquiAnalytix Speed Figures
The Foundation of Everything We Do
The EquiAnalytix Speed Figure is our proprietary rating system and the single most important metric in our entire platform. Every other metric we produce, from trainer analytics to breeding intelligence, is built upon these figures.
How They're Calculated
Our speed figures are built on the fundamental principles of speed rating methodology, then enhanced with our rich 20+ year database to make sophisticated statistical adjustments for:
- Going conditions - how the ground affects times and performance
- Distance - normalising performances across different trip lengths
- Track configuration - accounting for undulations, turns, and course characteristics
- Class of race - weighting performances against the quality of opposition
Why They Matter So Much
The EquiAnalytix Speed Figure drives everything on our platform:
- • All trainer metrics are averages of their runners' speed figures
- • All breeding metrics are averages of progeny speed figures
- • Condition-specific ratings (Going, Distance, Track) are filtered averages
- • The TPR machine learning model weights speed figures most heavily in its calculations
T-1 to T-5: Recent Form
On the dashboard, you'll see each horse's speed figures from their last five runs:
| Column | What It Shows |
|---|---|
| T-1 | Most recent run (most important) |
| T-2 | Second most recent |
| T-3 | Third most recent |
| T-4 | Fourth most recent |
| T-5 | Fifth most recent (least important) |
The Benchmark
The baseline. A speed figure of 100 represents a standard performance for that class of race.
What matters more than absolute numbers is whether a figure stands out relative to the rest of the field. If every horse in a race has T-1 figures between 95 and 105, and one horse has 135, that's a significant edge.
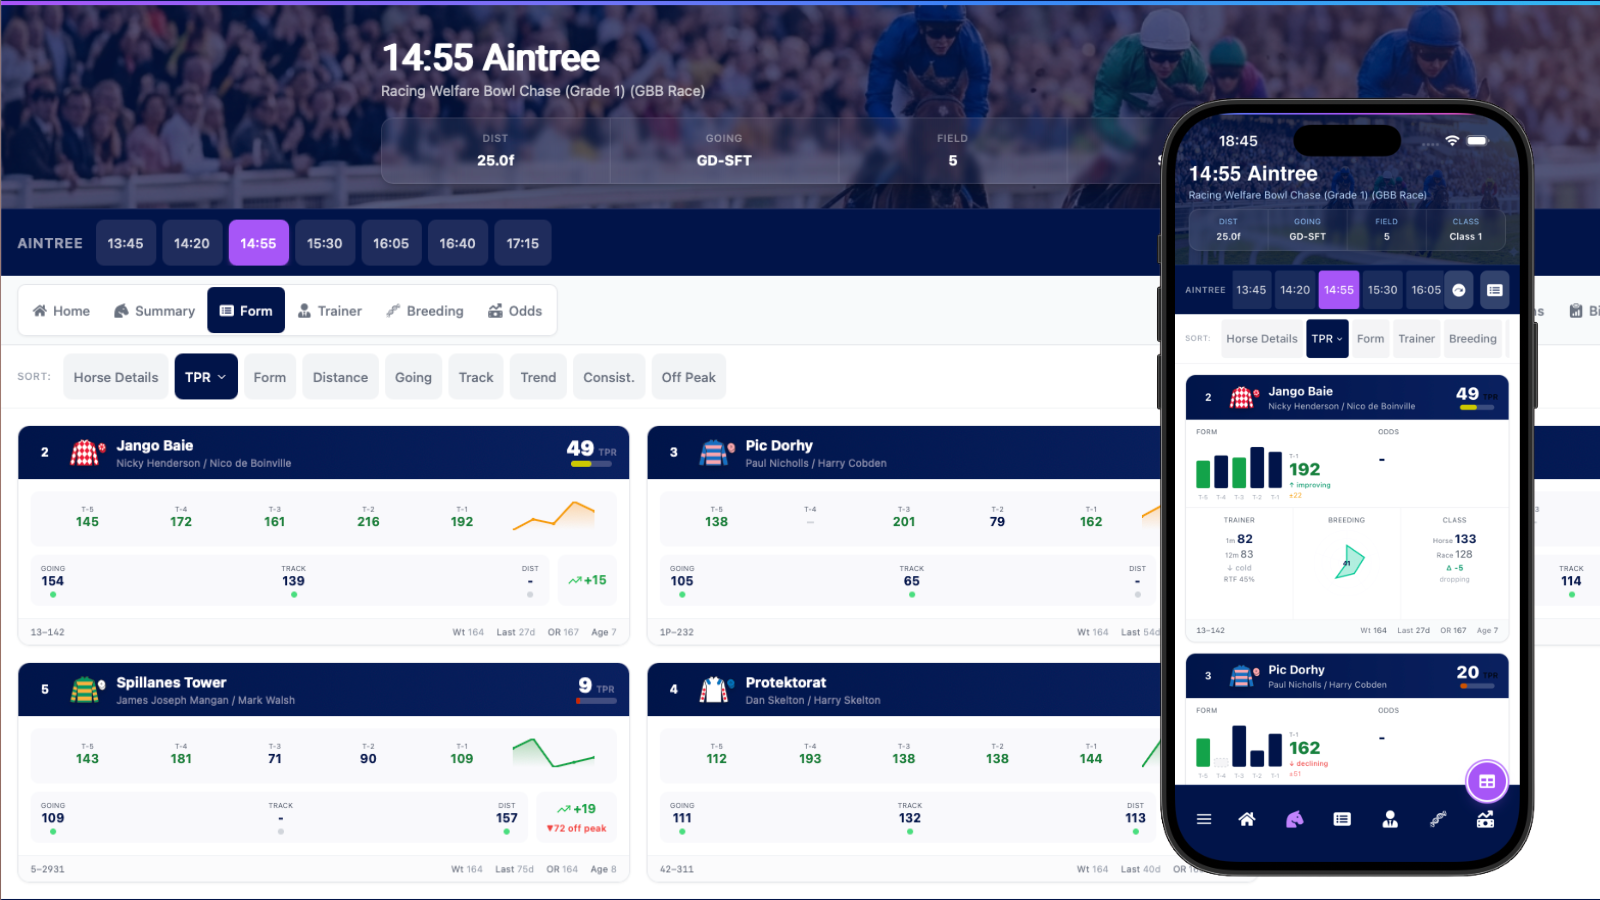
Speed Figures Display with Sparkline Trends
The Sparkline Chart
In the Summary and Form modules, you'll see a small chart next to the speed figures. This is a sparkline, a miniature line graph showing the trajectory of T-3 → T-2 → T-1.
Upward trend (T-1 ≥ T-2 ≥ T-3), the horse is improving
Downward or inconsistent trend, the horse is declining or volatile
The Recency Hierarchy
Condition-Specific Ratings
This is the horse's average EquiAnalytix Speed Rating on today's ground conditions.
If a race is on soft ground and a horse has a Going rating of 125, they've proven they handle soft. If their Going rating is 0, they've either never run on soft, or they've run so poorly on it that the data isn't meaningful.
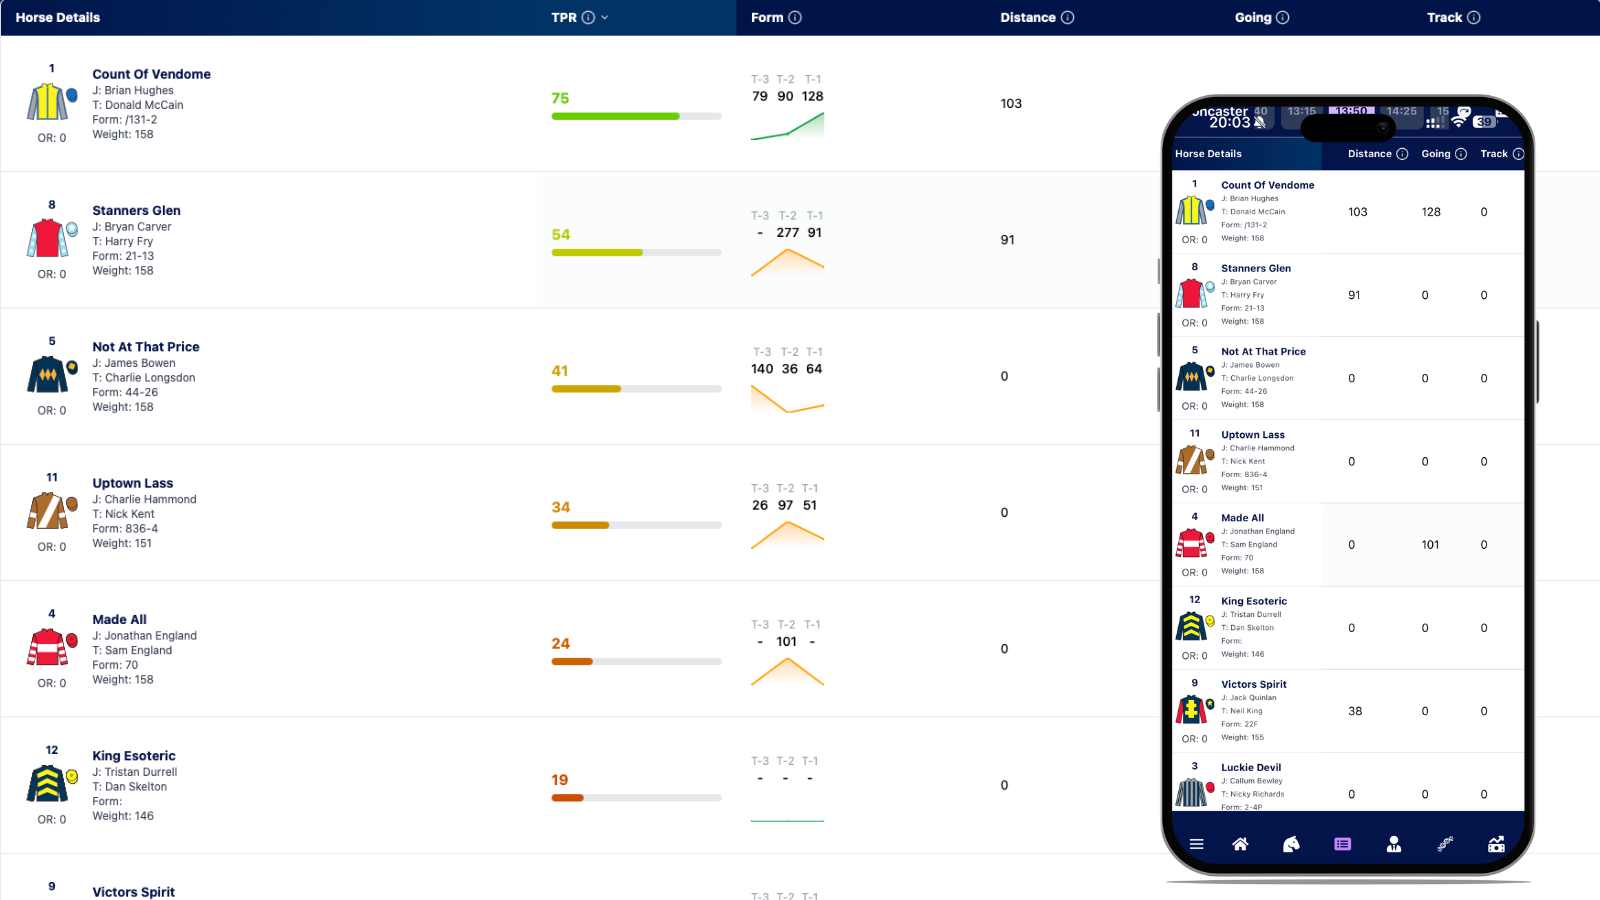
Condition-Specific Ratings Comparison
Trainer and Jockey Analytics
Why Trainer Form Matters
Trainers go through hot and cold spells. A yard in form, with horses running to their ratings and winners ticking along, is more likely to produce another winner than a yard where nothing is firing.
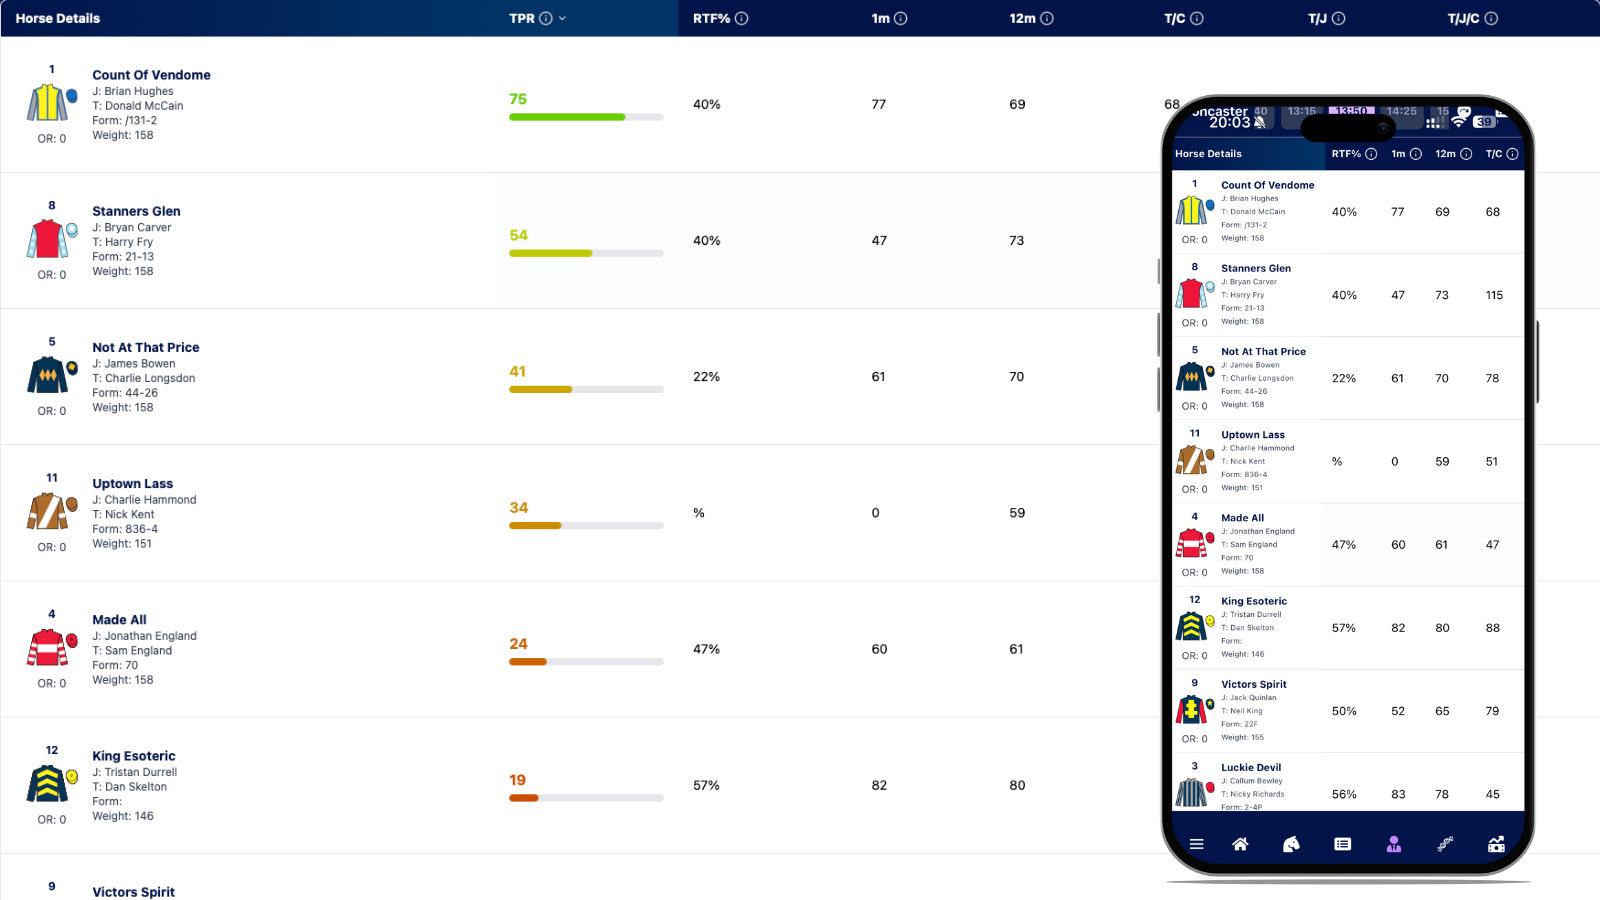
The Core Trainer Metrics
| Column | Description |
|---|---|
| 1m | The average speed rating of this trainer's runners over the past month |
| 12m | The average speed rating over the past year. This is the baseline. |
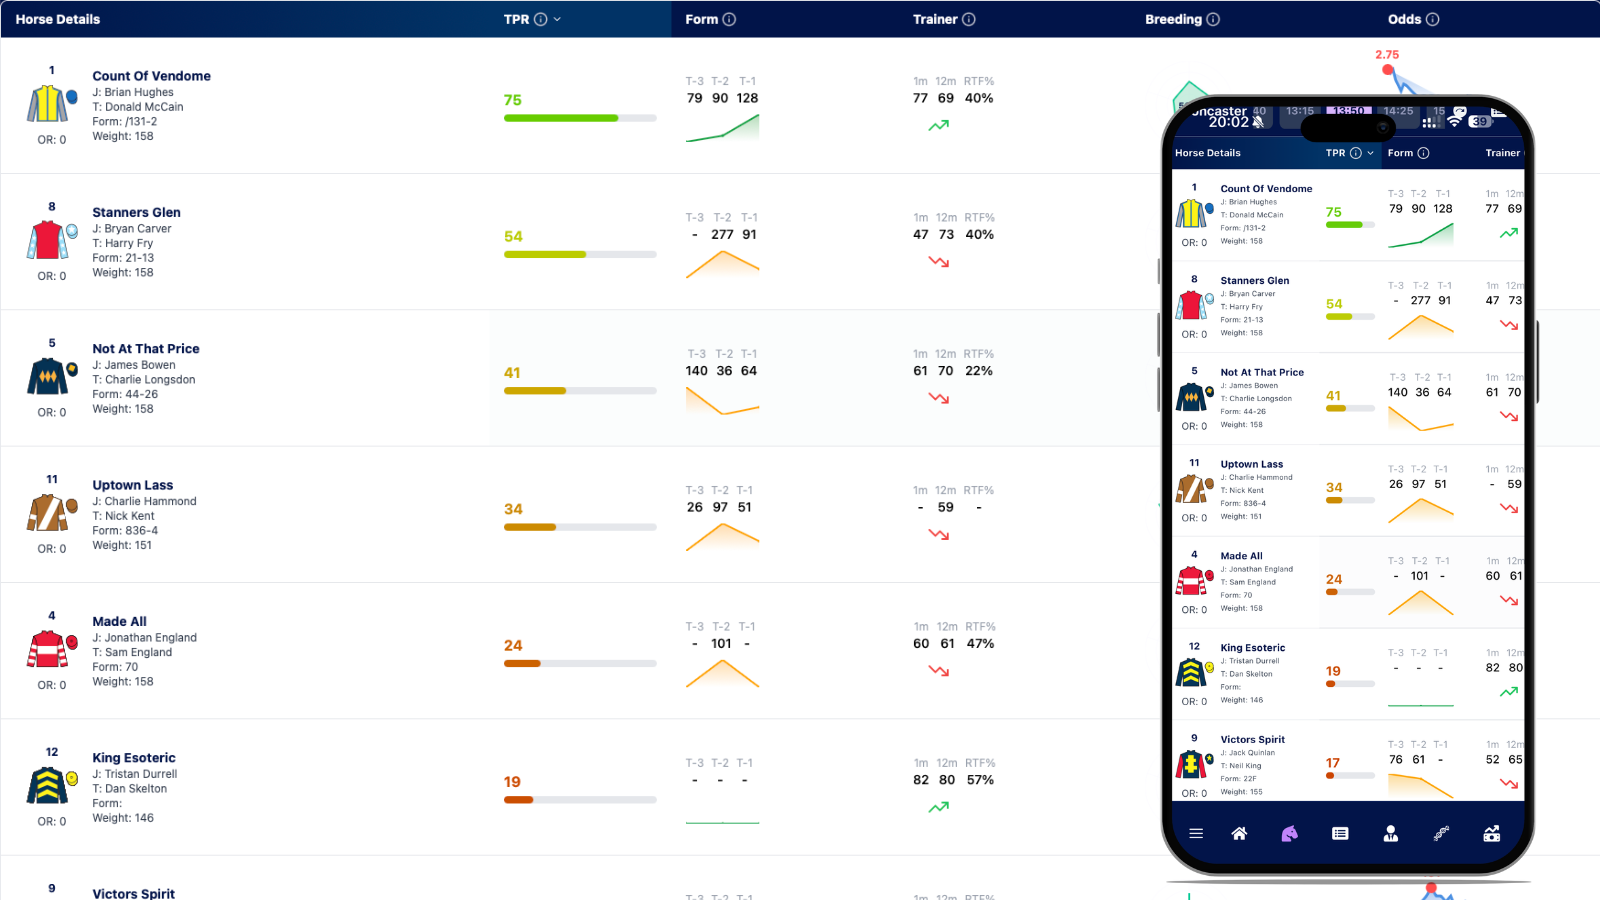
Trainer Form Indicators
RTF% (Runs To Form)
This tells you what percentage of a trainer's runners performed to their expected level in the last month.
Reliable yard. Horses are running their races. Look for the flame icon!
Something's off. Maybe a virus, maybe a change in routine, maybe bad luck.
Jockey Metrics
We track the same figures for jockeys: JockeyTPR (1 month) and JockeyTPR (12 months). A jockey in hot form can elevate an average horse. A jockey struggling for confidence can cost you on even the best-rated runner.
Combination Metrics
Sometimes trainer and jockey together are better than the sum of their parts:
| Column | What It Measures |
|---|---|
| T/C | Trainer's record at this specific course (12 months) |
| T/J | Trainer and jockey combination record (12 months) |
| T/J/C | Trainer, jockey, and course combined (12 months) |
High combination metrics (relative to individual metrics) suggest synergy. Low combination metrics suggest the partnership doesn't click or lacks experience together.
Breeding Intelligence
When Breeding Matters
Breeding data becomes critical in specific situations:
Unraced Horses
Bumpers and debut runs where there's no form to analyse
Lightly Raced
One or two runs isn't enough data to trust TPR alone
Untested Conditions
First time on soft ground, or trying 3 miles for the first time
| Column | Description |
|---|---|
| Sire | The horse's father. Listed for reference. |
| Ovr | Average rating achieved by all this sire's progeny |
| Going | How does this sire's progeny perform on today's ground? |
| Dist | Does this sire produce horses who stay? |
| Type | How do this sire's progeny perform on the flat, over hurdles, chases, or in NH Flat races? |
| Novice | Average rating for this sire's progeny as a 2yo (Flat) or 3yo (NH) |
The Breeding Hexagon
In the Summary and Breeding modules, you'll see a hexagonal chart for each horse. This visualises five sire metrics:
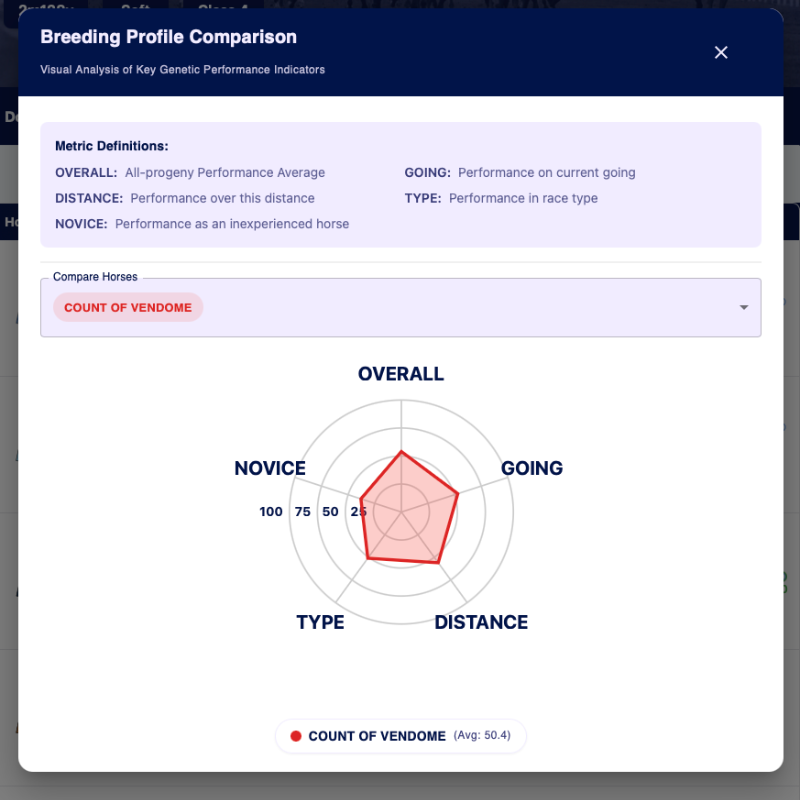
Breeding Hexagon Visualization
- 1. Ovr (Overall) - average of all progeny
- 2. Going - progeny performance on today's conditions
- 3. Dist - progeny performance at today's trip
- 4. Type - progeny performance in this race type
- 5. Novice - progeny performance as inexperienced horses
A larger, more symmetrical hexagon indicates a sire whose progeny handle diverse conditions. A small or lopsided hexagon indicates a specialist or a sire with weaknesses.
Form History
What It Contains
Click on any horse in the dashboard to open the Horse Profile Modal. This shows the horse's complete recent history: dates, courses, positions, going, distance, class, speed ratings, and importantly, race comments.
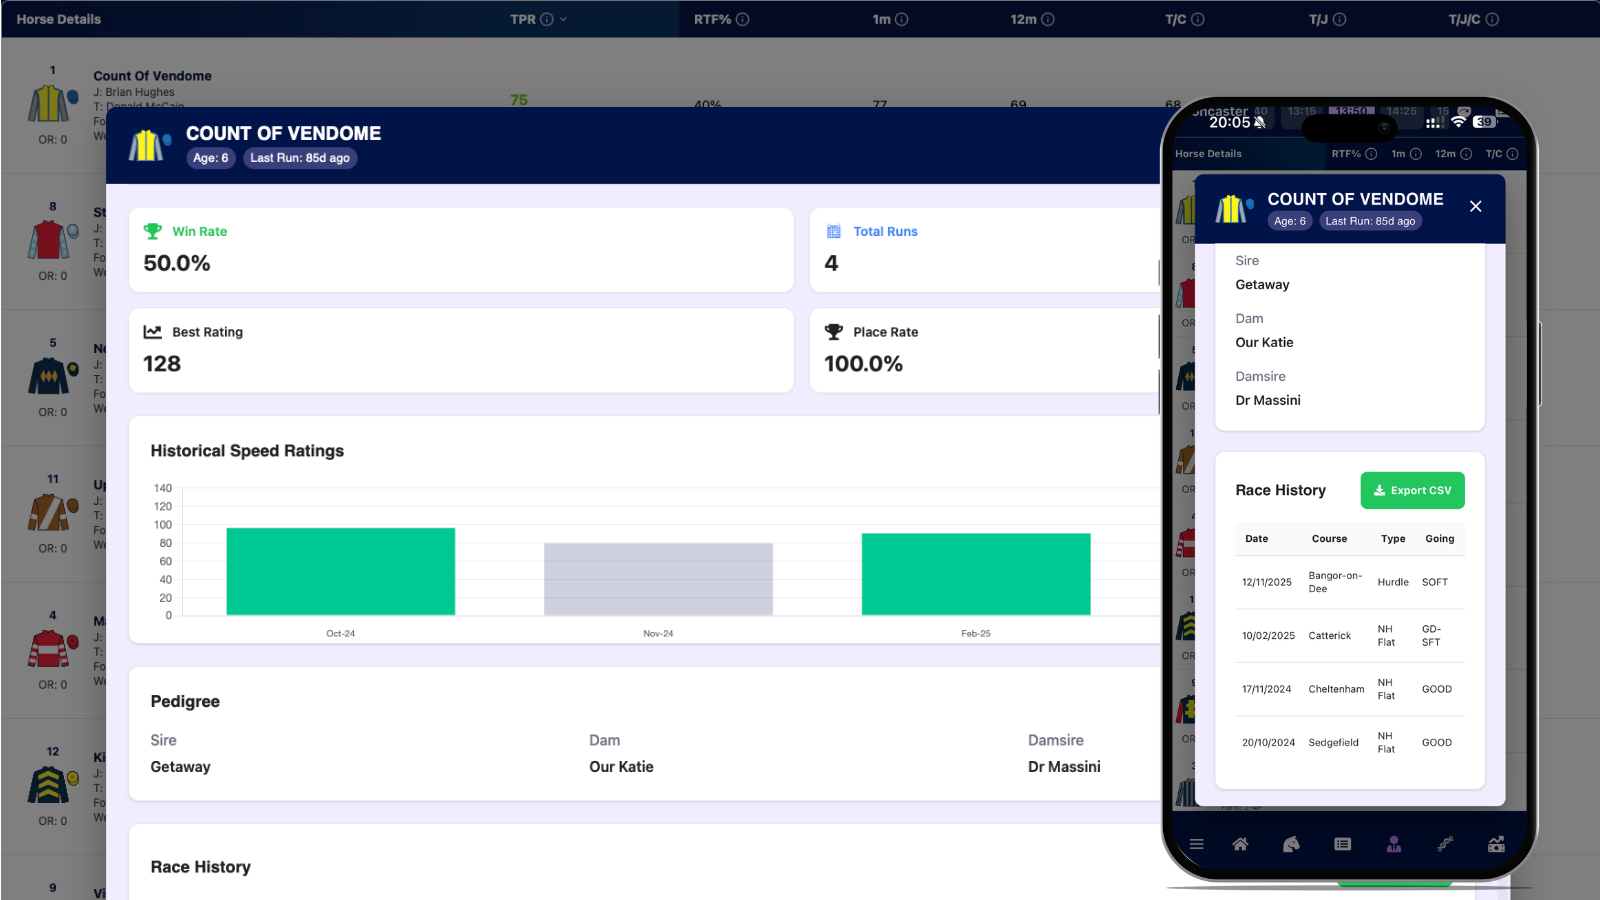
Horse Profile Modal with Form History
The Statistics Summary
At the top of the profile, you'll see:
The Race History Table
| Column | What It Shows |
|---|---|
| Date | When the race took place |
| Course | Where the race was run |
| Type | Flat, Hurdle, Chase, etc. |
| Going | Ground conditions |
| Distance | Trip in furlongs |
| Position | Where the horse finished |
| Rating | The EquiAnalytix speed figure for that run |
| OR | Official handicap mark at the time |
| Comment | In-running notes and analysis |
Why Form Comments Matter
A finishing position doesn't tell the whole story. A horse finishing 4th might have been:
- • Unlucky in running, hemmed in with nowhere to go
- • Not suited by the ground
- • Returning from injury and needing the run
- • Outpaced and never competitive
Live Odds and Market Intelligence
The Odds Column
In the Summary and Odds modules, you'll see current prices from major bookmakers including Bet365, William Hill, Coral, and Betfair Exchange.
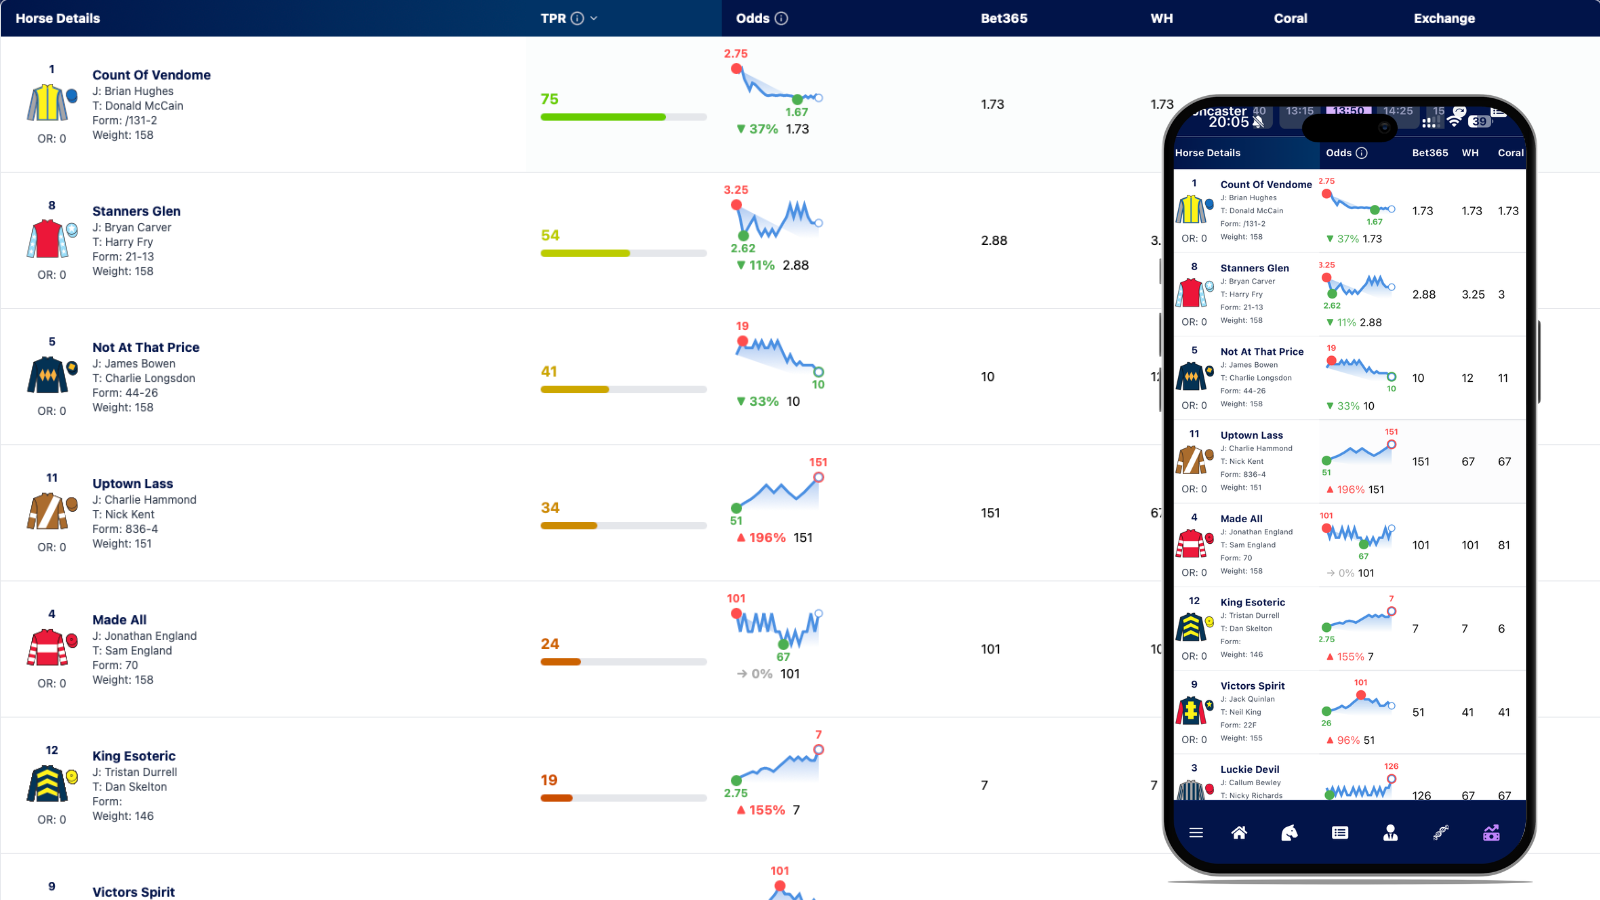
Live Odds Display with Multiple Bookmakers
The Odds Sparkline
Next to the odds, you'll see a mini sparkline chart showing how the price has moved since the market opened:
Price has shortened, money is coming for this horse
Price has lengthened, money going elsewhere
The Odds History Modal
Click on any odds cell to open the Odds History Explorer. This powerful tool lets you:
- Compare multiple horses: see their price movements on the same chart
- Compare multiple bookmakers: spot value or understand market sentiment
- View the summary table: Open, Current, Change %, Max, Min prices
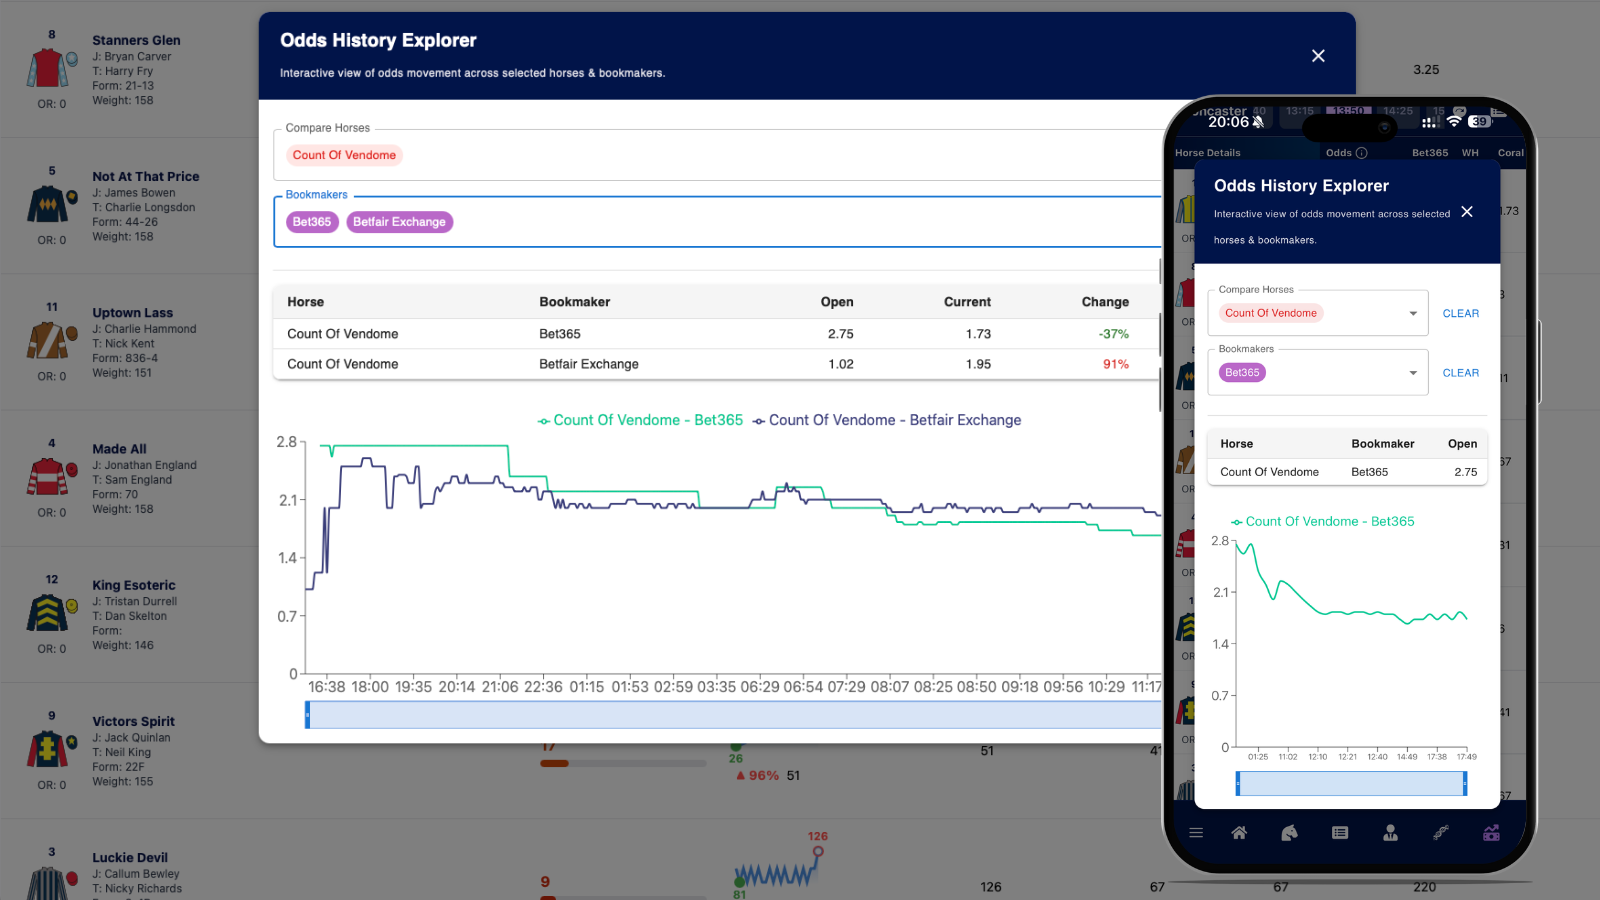
Odds History Comparison Chart
Reading Market Movements
Significant shortening (steamer)
Money is coming. Could be informed money, could be public sentiment. Worth noting, especially if the data supports the move.
Significant drifting
Money is going elsewhere. Doesn't mean the horse can't win, but the market is cooling on them.
Stable price
The market has found equilibrium. No major information flow.
Late money
Significant moves in the final 30 minutes before the off often indicate informed betting.
Pace Analysis
The Pace Map
Click Pace in the dashboard navigation to open the Pace Map. This visualises likely early race positioning based on historical running styles.
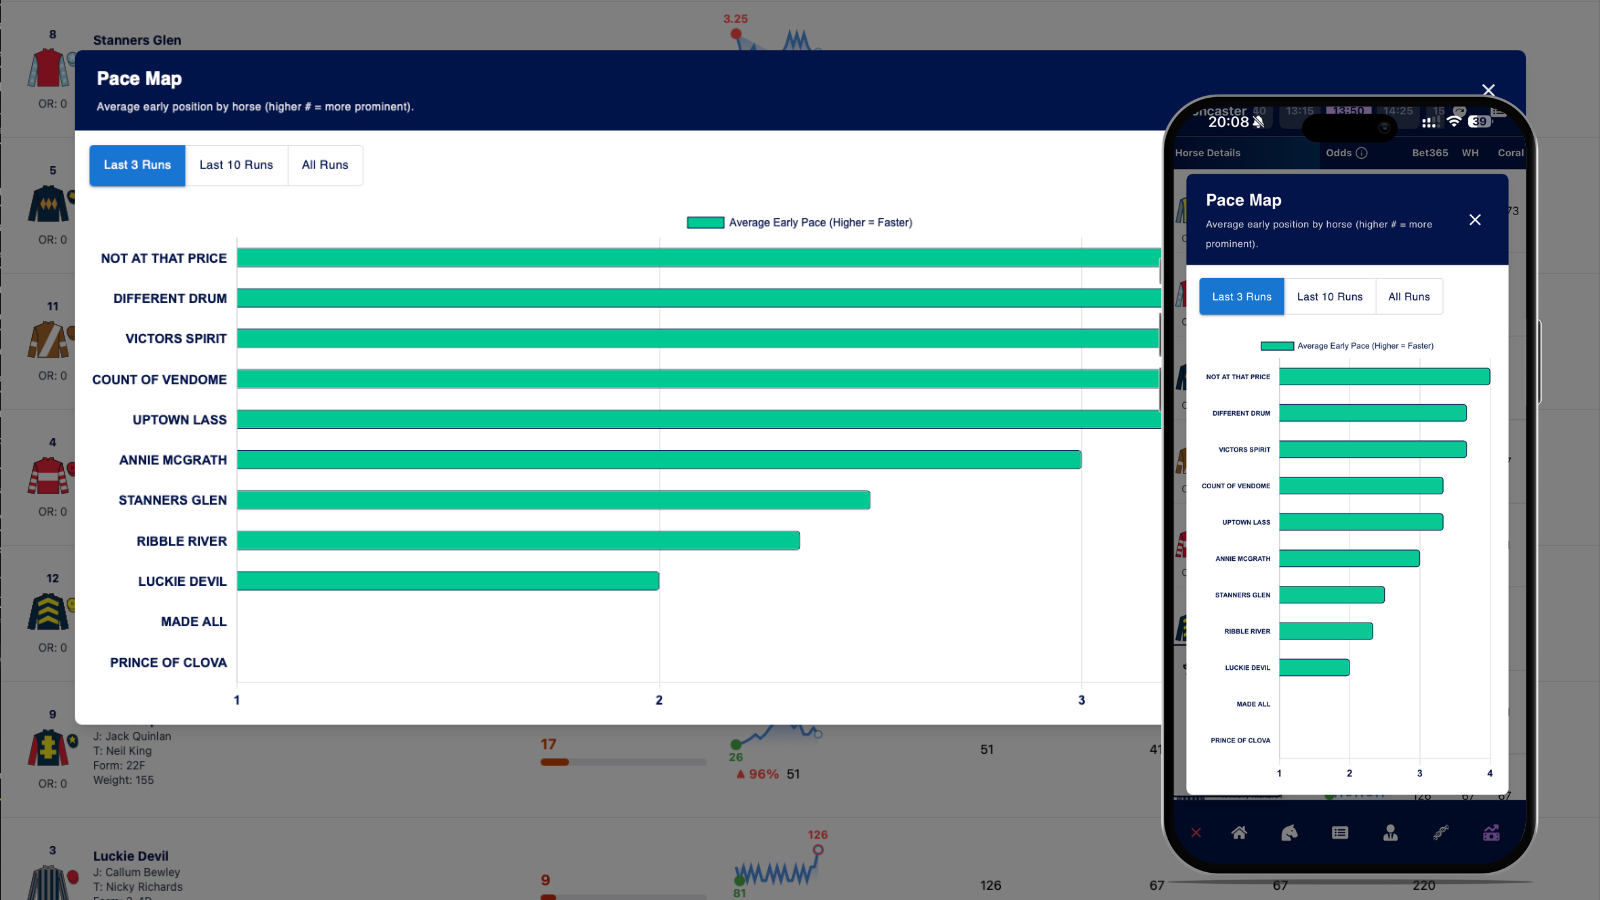
Pace Map Visualization
Understanding the Scale
The scale runs from 1 to 4:
Time Period Filters
You can filter by:
Why Pace Matters
PaceScore and PaceStyle
Each horse now has a quantified PaceScore visible in the Card View and Pace Map modal. This is a weighted average of their last 5 runs' early positions, with more recent runs counting more heavily.
| PaceScore | PaceStyle | Description |
|---|---|---|
| ≥ 3.5 | Front-Runner | Confirmed leader. Wants to be in front. |
| 2.5 – 3.49 | Prominent | Races near the pace. Likes to be handy. |
| 1.5 – 2.49 | Mid-Division | Flexible or inconsistent running style. |
| < 1.5 | Hold-Up | Needs to be delivered late. Relies on others setting the pace. |
Race Pace Forecast
The race header now shows a pace forecast based on how many runners in the field have a PaceScore of 3.0 or above. This tells you whether to expect a strong gallop or a tactical crawl.
| Forecast | Condition | What It Means |
|---|---|---|
| Strong | ≥35% of field or 5+ pace pressers | Fast early pace. Favours hold-up horses and closers. |
| Fair | ≥20% of field or 3+ pace pressers | Genuine gallop. Most running styles can compete. |
| Moderate | 2 pace pressers | Adequate pace but no battle. |
| Slow | 0-1 pace pressers | Tactical race. Favours those who can make their own running. |
Form Consistency and Trends
The dashboard now surfaces pre-calculated form analysis that quantifies patterns you'd previously need to calculate manually. These metrics sit in the Form module (table view) and the Summary section (card view).
FormStdDev (Consistency)
Standard deviation of the last 3 speed figures (T-1, T-2, T-3). Lower means the horse runs to a consistent level. The dashboard shows it as a coloured badge.
| Value | Label | What It Means |
|---|---|---|
| ≤ 10 | Consistent | The horse runs to a similar level every time. What you see is what you get. |
| 11-20 | Mixed | Some variation — investigate form comments for excuses. |
| 21-25 | Volatile | Significant swings. Check form history for patterns. |
| > 25 | Highly Volatile | Big days and bad days in equal measure. High risk. |
RecentTrend (Improving or Declining)
The formula is simple: T-1 minus T-3 (most recent figure minus two runs ago). Positive means the horse is running faster now. Negative means they're running slower.
The dashboard shows a green up-arrow if the trend is above +3, and a red down-arrow if below -3. For example, +15 means the horse has improved by 15 speed figure points over two runs. -20 means a significant decline — check form comments for why.
PeakToRecent (Off Peak)
The gap between the horse's best figure (from T-1 to T-5) and their most recent run. Zero means the horse's last run was their peak — they're at the top of their game right now. The dashboard shows "PEAK" in green. A value of 30+ means significant regression from best, shown in red.
Form Bars (Card View)
In the card view, the last 5 runs are displayed as discrete bars (T-5 to T-1, left to right). Green bars indicate races the horse won. Navy bars are non-winning runs. Grey dashed bars mean no data for that run. The height of each bar represents the speed figure value, making it immediately obvious which runs were strong and which were poor.
Form Consistency Metrics in Table and Card View
Class and Handicap Intelligence
Two new intelligence modules help you assess whether a horse is running at the right level today. The Class module tells you whether a horse is stepping up or dropping down. The Handicap Mark module tells you whether the weights favour them.
Understanding Class Values
Classes are mapped to numeric values (higher = higher class). The approximate scale: Class 7 is around 85-95, Class 5 is 105-110, Class 3 is 115-120, Group races are 130-145. These are EquiAnalytix proprietary class ratings — no other platform has this data.
ClassDelta — The Key Class Metric
The headline metric. Formula: TodayClassEstimate minus ClassAvg3. A negative number means the horse is DROPPING in class — running in an easier race than their recent form. A positive number means they're STEPPING UP into harder company.
| ClassDelta | Colour | Meaning |
|---|---|---|
| ≤ -3 | Green | Significant class drop. Horse has been competing at a much higher level. |
| -2 to +2 | Grey | Level transfer. Running at roughly the same grade. |
| ≥ +3 | Red | Stepping up. Harder race than recent form suggests. |
TodayClassEstimate
The median of all runners' ClassAvg3 values in this race. Same for every horse. This is the dashboard's estimate of "what level is this race actually at?" It's shown in the race header stats bar.
The Handicap Mark Module
This only appears in handicap races. The dashboard shows a semicircular gauge visualising how far the horse's current OR has moved from its last winning mark.
ORDelta — The Key Handicap Metric
Current OR minus LastWinOR. Negative means the horse has been dropped BELOW its winning mark — the handicapper has lowered it since it last won. Positive means the horse has been RAISED above its winning mark.
| Category | ORDelta Range | Colour | Signal |
|---|---|---|---|
| Well In | ≤ -5 | Green | Strong positive. Significantly below winning mark. |
| Near Winning Mark | -4 to +1 | Emerald/Grey | Neutral. Close to the mark that produced a win. |
| Higher Than Last Win | +2 to +7 | Orange | Mild negative. Raised since last win. |
| Well Above | ≥ +8 | Red | Strong negative. Well above winning mark. |
ORTrajectory
Shows whether the handicapper is raising, lowering, or holding the mark over the last 3 handicap runs. Rising means the task is getting harder. Falling means it's getting easier. The dashboard shows an arrow icon next to OR in the gauge and footer.
When to Use Which
Handicaps
Lean on ORDelta and ORTrajectory. The mark is the battleground. ClassDelta adds context.
Non-Handicaps
ORDelta is null. Lean on ClassDelta, ClassCeiling, ClassAvg3. Is this horse running below its proven level?
Class Delta and Handicap Mark Gauge in Dashboard
Track Bias Analysis
The Bias Modal
Click Bias in the dashboard navigation to open the Race Bias Explorer. This shows historical data on how pace and draw (Flat) or pace and going (Jumps) have influenced results at this course.
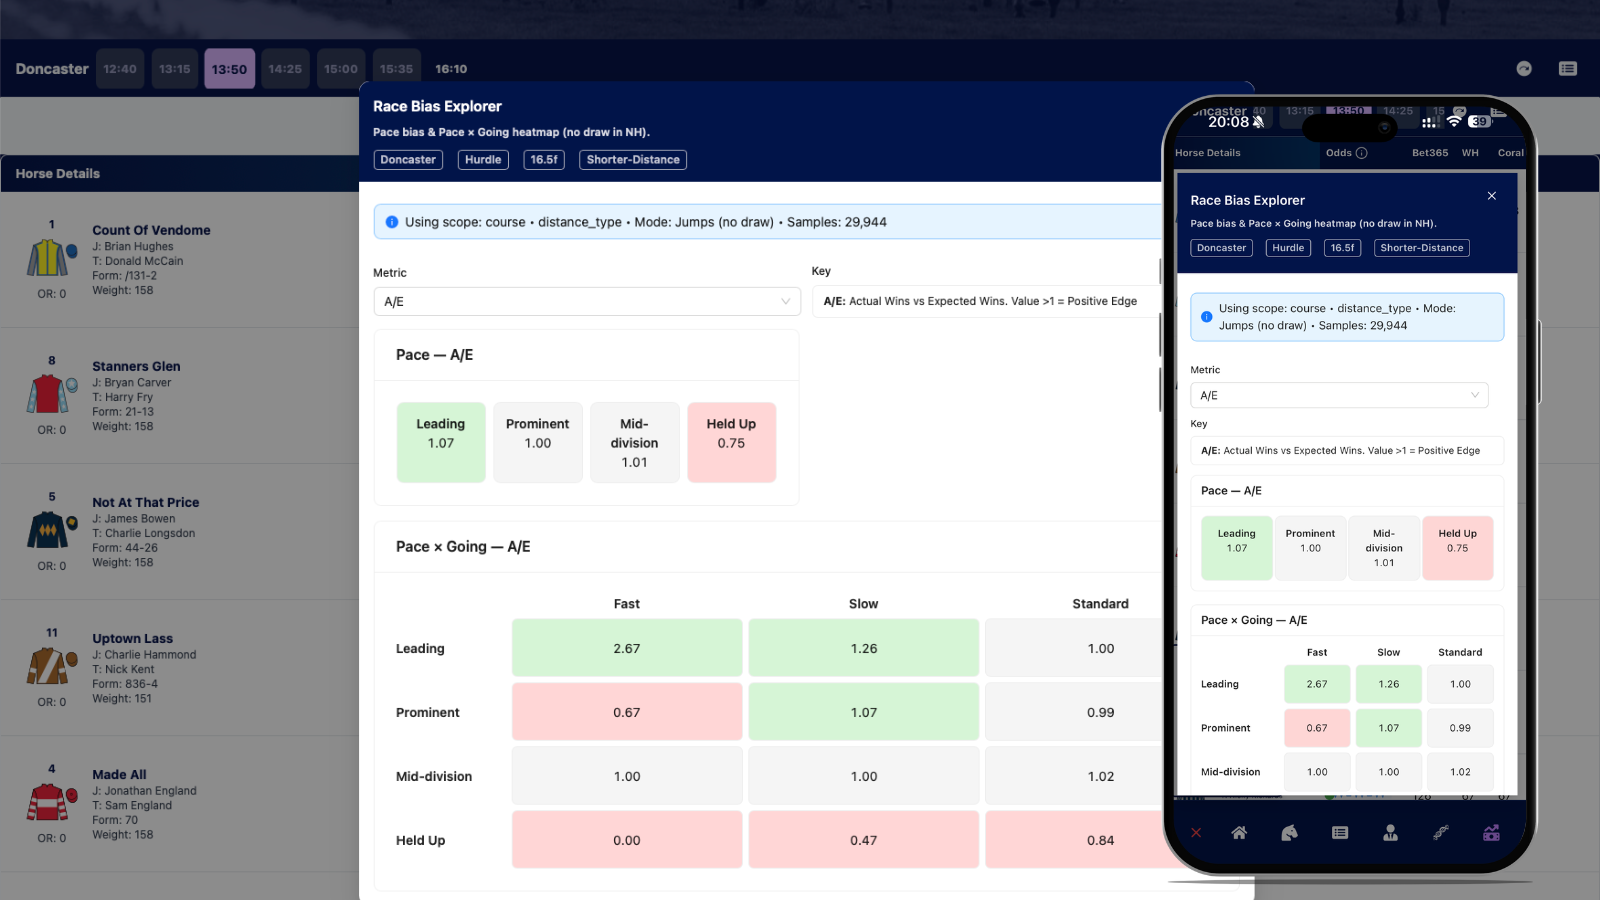
Track Bias Analysis Modal
What It Shows
For Flat Racing
- • Pace Summary
- • Draw Summary (low/middle/high)
- • Pace × Draw Matrix (heatmap)
For Jump Racing
- • Pace Summary
- • Pace × Going Matrix
Understanding the Metrics
| Metric | What It Means |
|---|---|
| A/E (Actual vs Expected) | Wins divided by expected wins based on market prices. Above 1.0 = better than expected. |
| Strike Rate | Simple win percentage for that category |
| ExpR (Expected Rate) | What the win rate "should" be based on starting prices |
| Raw Change | Strike Rate minus Expected Rate. Positive = outperforming. |
| Runs | Sample size, how many runners in that category |
| Wins | Number of winners in that category |
| ΔTPR | Change in average EquiAnalytix speed rating for that category |
Colour Coding
Predictions and Quick Analysis
The Predictions Modal
Click Predictions in the dashboard navigation to see the top 3 horses across four categories:
Overall Form
TPR Rating, our headline metric
Best Bred
Breeding metrics
Recent Form
T-1, most recent speed figure
Trainer Form
1m trainer average, yard momentum
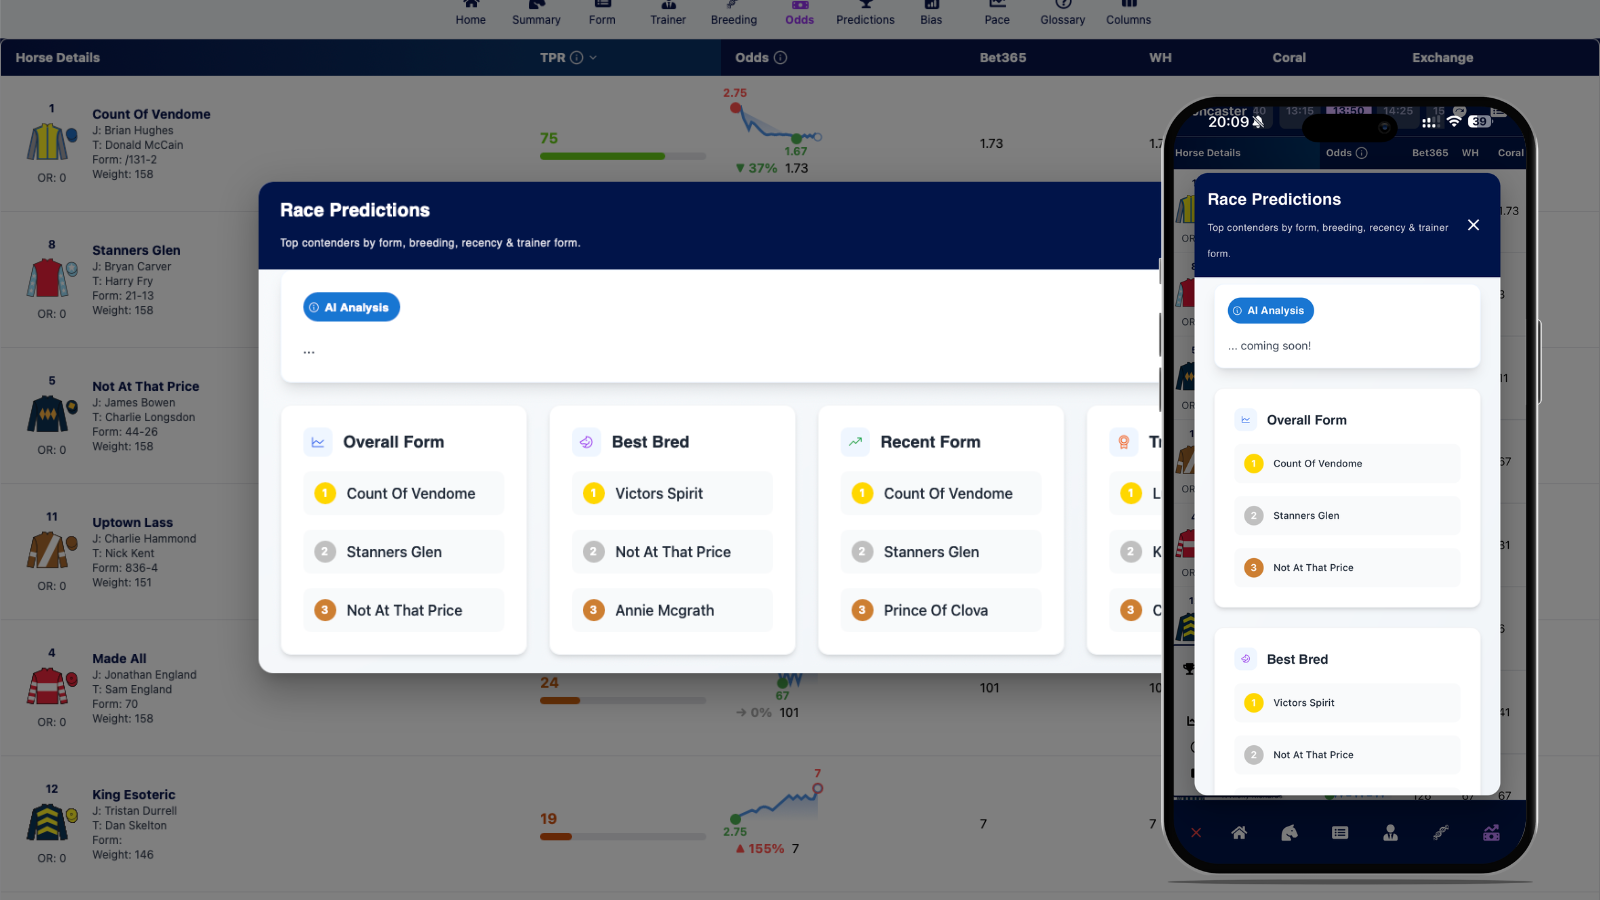
Predictions Modal with Medal Rankings
The Strategy Builder
What It Is
The Strategy Builder is a powerful filtering and analysis tool. Access it from the landing page by clicking Strategies.
Three Tabs
Filters
Build custom filtering rules to find horses that match specific criteria.
Results
See the horses that pass your filters, sortable by any metric.
Movers
Track market movers (steamers and drifters) across today's and tomorrow's cards.
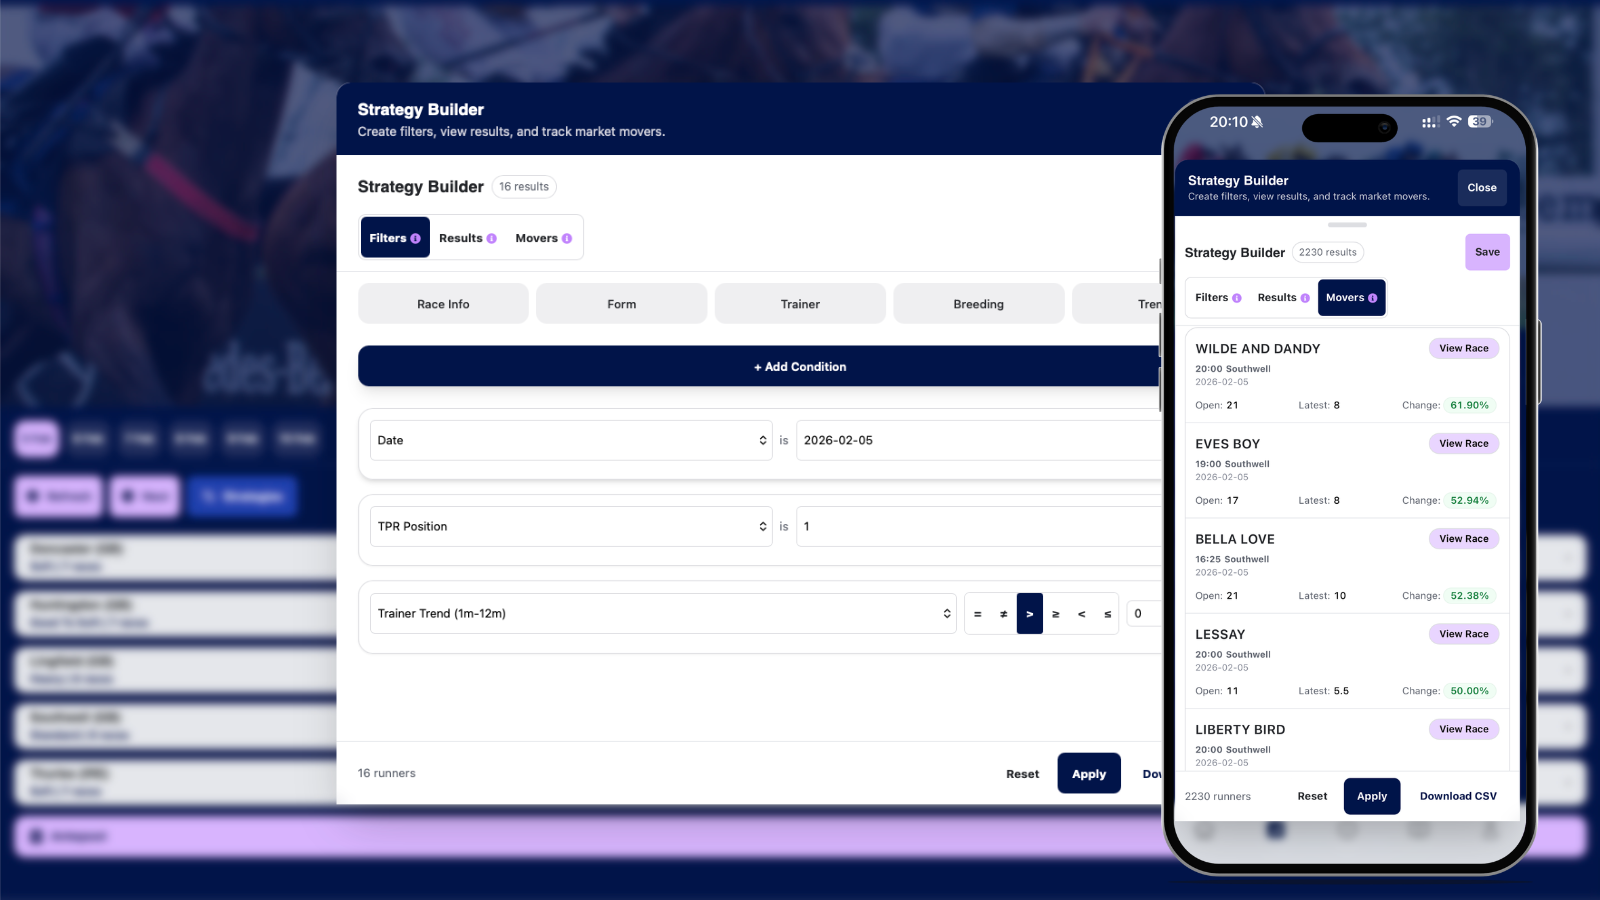
Strategy Builder Interface
Building Filters
Click + Add Condition to add a filtering rule. You can filter by:
| Category | Available Fields |
|---|---|
| Race Info | Date, Meeting, Race, Horse |
| Form | TPR, TPR Position, T-1, T-2, T-3, GoingTPR, DistTPR |
| Trainer | Trainer 1m, Trainer 12m, Trainer Trend (1m minus 12m) |
| Breeding | SireTPR, SireGoingTPR, SireDistTPR, SireTypeTPR, DamsireTPR |
| Trends | Trainer 1m > 12m (hot yard), T-1 > T-2 > T-3 (improving) |
Market Movers
The Movers tab fetches live odds data and calculates price movements for every runner. You can:
- • Select dates: Today, tomorrow, or both
- • Choose a bookmaker: Bet365, William Hill, Sky Bet, Paddy Power, Ladbrokes, or Betfair Sportsbook
- • Filter by direction: Steamers or Drifters
- • Set display limit: Top 10, 25, 50, 100, or all
The Selection Framework
Here's the complete step-by-step process for making data-driven selections:
Identify the TPR Leaders
Find the top four on TPR. These are your primary candidates. Two-thirds of winners come from this group.
Check Recent Speed Figures
For each of the top four, look at T-1, T-2, T-3. Are they improving, consistent, or declining? Look for standouts.
Assess Form Consistency
Check FormStdDev — is this horse consistent (≤10) or volatile (>25)? Look at RecentTrend — improving or declining? Check PeakToRecent — are they at peak form (0) or regressing?
Apply Conditions
Check GoingTPR, DistTPR, TrackTPR for each candidate. Any red flags? Any standouts?
Check Class and Handicap Position
In handicaps, check ORDelta — is the horse "Well In" or "Well Above" its winning mark? Check ClassDelta — are they dropping in class (negative) or stepping up? The combination of class drop + well handicapped is the strongest profile.
Assess Trainer Momentum
Is the stable running hot (1-month > 12-month)? What's the RTF%? Look for the green trend arrow and flame icon.
Check Breeding (If Needed)
For lightly-raced horses or untested conditions, examine the hexagon. Does the sire's progeny handle today's conditions?
Read the Form Comments
Open the horse profile and scan recent comments. Any excuses for poor runs? Any warning signs?
Consider Pace
Open the Pace Map. Is your selection suited to the likely race shape? Check the Race Pace Forecast in the header.
Check for Bias
Open the Bias Modal. Does the track favour your horse's running style and draw/going combination?
Look for Convergence
The strongest selections are horses that lead TPR, have consistent form (low FormStdDev), are dropping in class (negative ClassDelta), are well handicapped (ORDelta "Well In"), and have favourable conditions. When everything points the same way, that's rare and valuable.
Make Your Selection
One pick. Backed by data. Defensible.
Selection Framework Flow
When a horse is:
- • Top 4 on TPR
- • Has the best or near-best T-1
- • Proven on today's going (high GoingTPR)
- • Trained by a yard in form
- • Bred to handle the conditions
...you have convergence. Multiple independent data points all suggesting the same answer.
Common Mistakes to Avoid
1. Ignoring TPR Rank
The statistics are clear: 67% of winners come from the top four on TPR. Starting anywhere else is fighting probability. Always begin with the leaders.
2. Over-weighting Old Form
A T-4 of 150 is impressive. But if T-1 is 90, something has changed. The horse that ran 150 four runs ago is not the same horse today. Recency matters. Always.
3. Ignoring Form Comments
A horse who finished 6th after being "denied a clear run" is different from one who finished 6th after being "outpaced from halfway." The position is the same. The information is completely different.
4. Chasing Longshots Without Data
A 33/1 shot can win. But if they're 33/1 and ranked 9th on TPR with declining speed figures and a trainer running cold, they're 33/1 for a reason.
5. Dismissing Trainer Form
Yards go through purple patches. A trainer running significantly above their baseline is meaningful, their horses are outperforming expectations. Don't ignore it.
6. Forgetting Ground Matters
On extreme going (heavy or firm), specialists win. A horse with no form on the ground is a genuine risk, regardless of how good they look on other metrics.
7. Assuming Convergence Always Exists
Sometimes the data doesn't give you a clean answer. Recognise when the data is fragmented and adjust your confidence accordingly.
8. Ignoring Market Movements
A significant steamer might indicate informed money. A significant drifter might signal a problem you haven't spotted. The market isn't always right, but it's always information.
9. Ignoring Class and Handicap Signals
A horse with ClassDelta of -8 is dropping massively in class. A horse with ORDelta 'Well In' is well below its winning mark. These are structural edges the dashboard now surfaces automatically. Ignoring them means missing some of the clearest signals in racing.
The Glossary
Quick reference for all metrics used in EquiAnalytix. Use the search and category filters to find what you're looking for.
Core Metrics
Trainer & Jockey
Breeding
Horse Data
Pace & Bias
Market
Conclusion
EquiAnalytix gives you data. What you do with it is up to you.
The framework is simple: start with TPR rank, stress-test with speed figures and conditions, factor in trainer momentum, apply context from form comments, consider pace and bias, look for convergence, and make a selection you can defend.
You won't win every race. Nobody does. But you'll make better decisions more often. And over time, that's what separates winners from the crowd.
The data is there. Use it.
Explore the DashboardEquiAnalytix | Data-Driven Racing Intelligence
UK | Ireland | Hong Kong | UAE
Ready to Transform Your Racing Analysis?
Whether you're looking to explore our platform, have questions about subscriptions, or want to discuss partnership opportunities, we're here to help.
Send us a Message
Fill out the form below and we'll be in touch soon.