EquiAnalytix has always been about turning racing data into actionable insight. This release closes a loop we have been working on for a long time: from researching today’s card, to building a strategy around what you find, to testing that strategy against months of historical racing, to applying the validated approach with confidence.
Three new features make that complete cycle possible inside the app. Archive lets you browse and analyse every race day back to 1 May 2026 – with a deeper history being built out in the coming months ahead. Backtest runs any saved strategy against that same historical data. And the Strategy Builder itself has been rebuilt from the ground up, with sixty-five filter fields organised by bucket and every one of them explained in plain English.
Alongside the headliners, the live dashboard has had a real polish. The TPR rating display is now a colour-coded circular ring that recomputes rank as non-runners are withdrawn. The odds pipeline has been rewritten to make one bulk request per race rather than one per horse, which removes the rate-limit hits that occasionally left charts empty. And the Market Movers tab has been refreshed in line with the rest of the app’s design language.
Here is what each piece does, and why we have built it this way.
The Archive
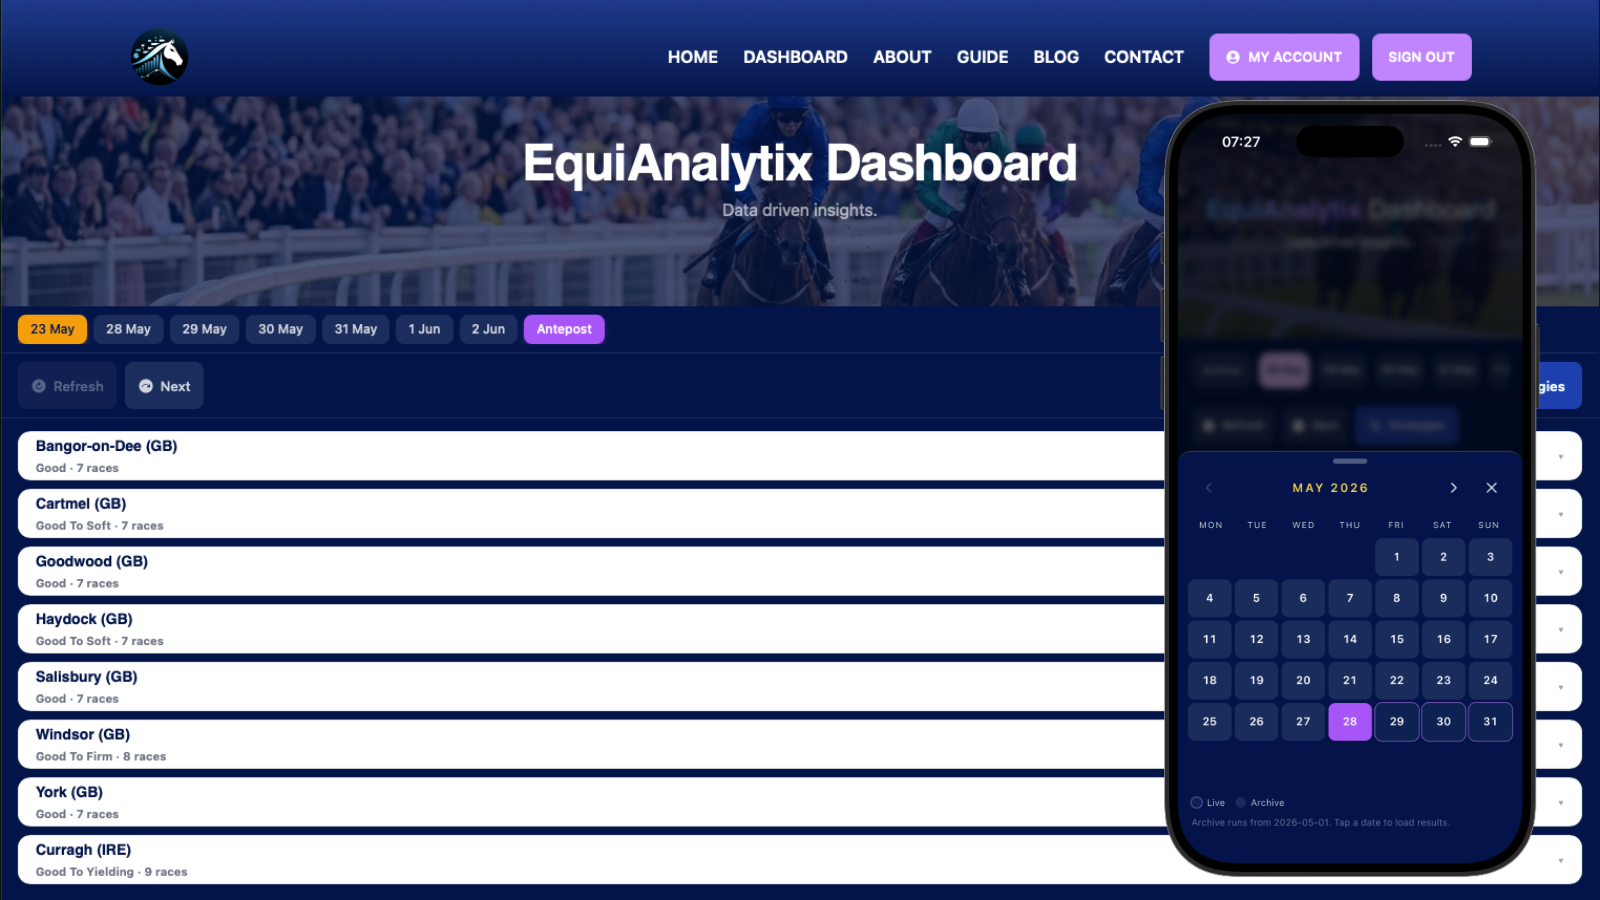
The new Archive feature lets you browse race days as far back as 1 May 2026 – with more data being added in the coming months. As we backfill historical coverage, that date moves earlier on its own. Tap the Archive chip on the home screen and pick a date from the bottom-sheet calendar. The meetings list populates exactly like a live day, but every race opens the full result dashboard: finishing positions, beaten distances, SP and BSP, tote dividends (Win, Place, Exacta, CSF, Tricast), and in-running commentary.
Switch between archived races on the day using the same race navigation bar as the live dashboard. Tap any horse for a complete result card with prize money and form-history class breakdown.
The framing matters. Live dashboards forecast. Archive shows you what actually happened. Same UI, same horse cards, populated with results instead of probabilities. Yesterday’s racing isn’t gone. It’s data.
Dashboard Results
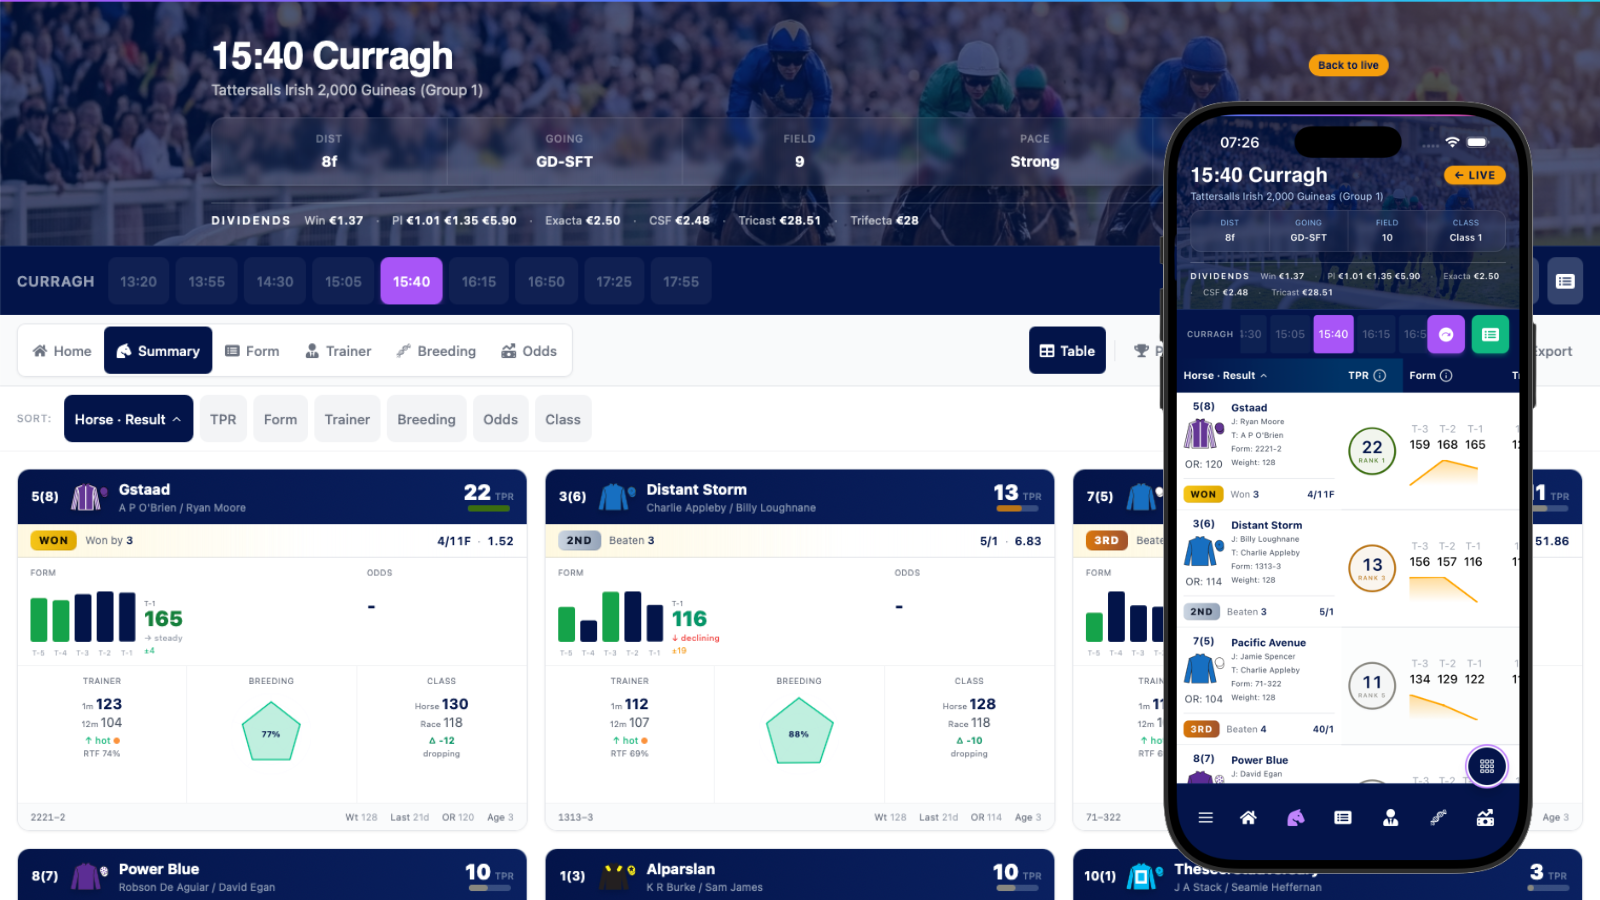
Once you’ve then selected a race from the Archive, it loads up that race in the exact same format you’d have seen it on the day. This was an important consideration in the update as I wanted to make sure that users saw the data for exactly what it was, irrespective of the final result.
We display the results in a clean, easy-to-read bar below each runner (at the top when using Card View), detailing the finish position, SP and the number of lengths beaten (won by). Upon loading, each card is automatically sorted by finish position by default, so you can immediately see how the Total Performance Rating did!
As for the TPR, we have also ensured that mobile app users see the exact same as on the desktop now. The ring colour reflects field-relative rank: deep green for the top pick, lighter green for the contender, amber for outsiders, grey for the also-rans. The big navy number in the middle is the TPR score. A small rank caption sits beneath it.
The killer detail is that the rank recomputes automatically as non-runners are withdrawn. The previously second-rated horse becomes Rank 1, with the deep-green ring, once the favourite is scratched. Most racing apps show stale ranks calculated against the declared field. We do this properly.
The odds pipeline has been rewritten from scratch
The old pipeline fired one network request per horse simultaneously. Fast on a good day, but on a busy field or a slow connection it routinely tripped the rate limit and left the page with no price data at all.
The new pipeline makes one bulk request per race for current prices, then quietly fills in historical movements in the background within the API’s documented rate budget. Every chart, every time.
Strategy Builder
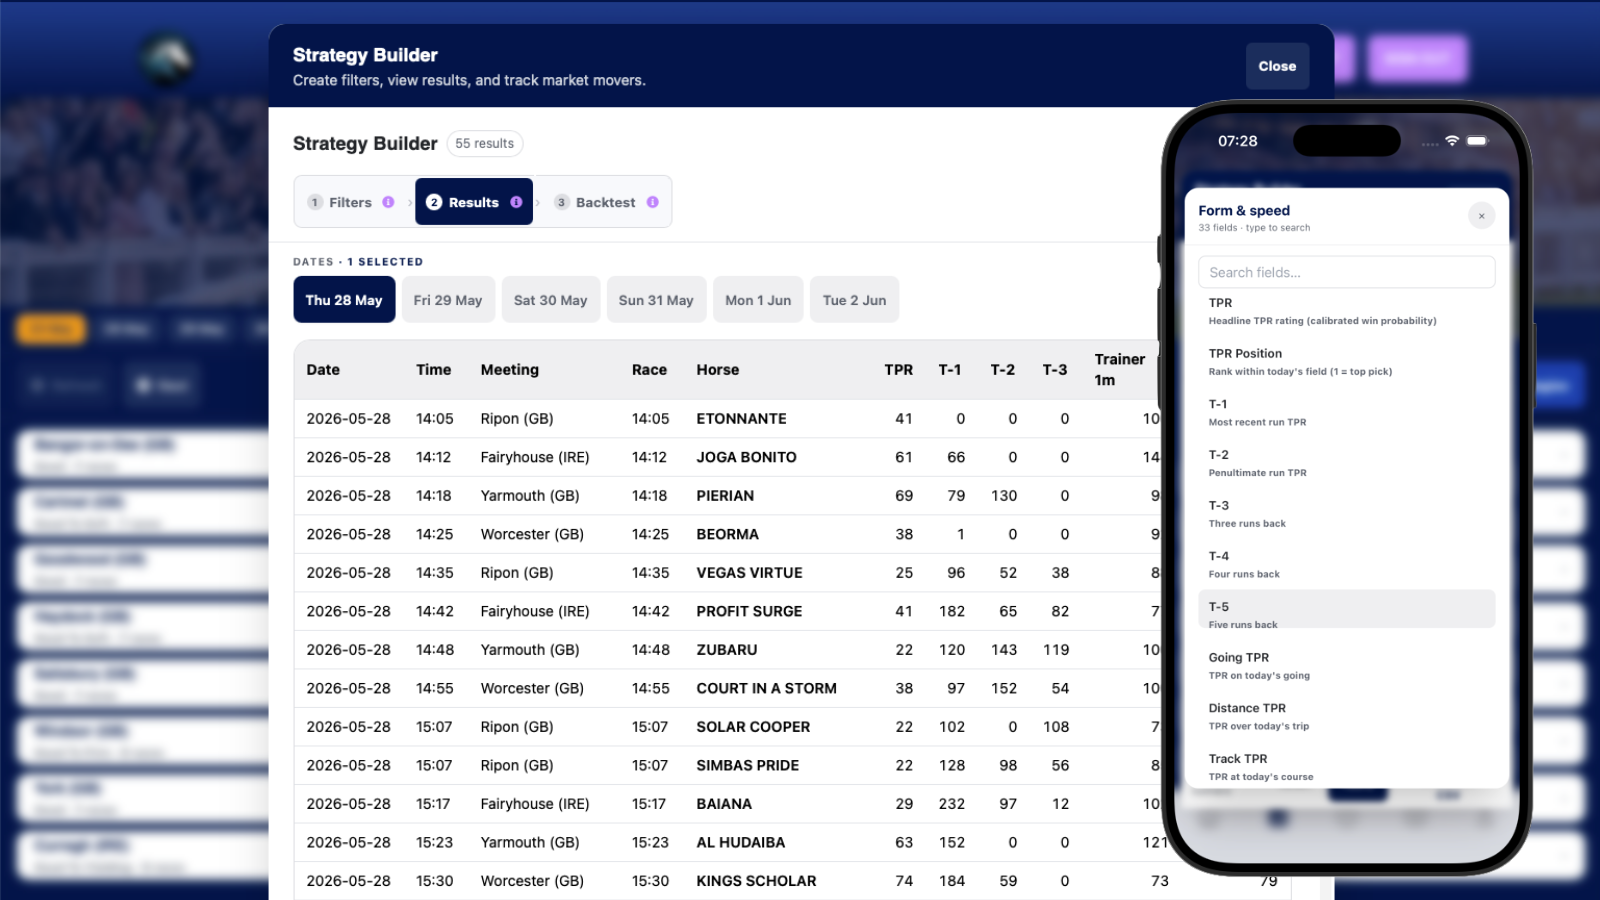
The Strategies modal has been rebuilt around a clear three-step workflow rail: Filters → Results → Backtest.
Inside Filters, sixty-five fields are now grouped by bucket: Race info, Form and speed, Trainer and jockey, Breeding, Trends and race-day. Where the old version had eighteen numeric inputs with cryptic names (“DistTPR”, “TrainerTrend”), the new one writes a plain-English hint under every field. “Negative = stepping down in class.” “Higher = more likely to push the pace.”
A new search-driven field picker filters as you type, so the depth is there when you need it without forcing you to scroll past sixty-five options when you do not.
Saved strategies persist across app updates and cache clears, now stored in proper native iOS or Android preferences. The saved-strategies row has become a horizontal-scroll strip, so you can keep dozens without dominating the modal. And a new date filter on the Results tab lets you narrow matches to today, tomorrow, or any subset of available days.
Most users will use five to ten of those sixty-five fields. The point isn’t that you have to read every one. The point is that the depth is there when you need it, and every field is documented.
Backtesting
This is the feature we have been asked for most.
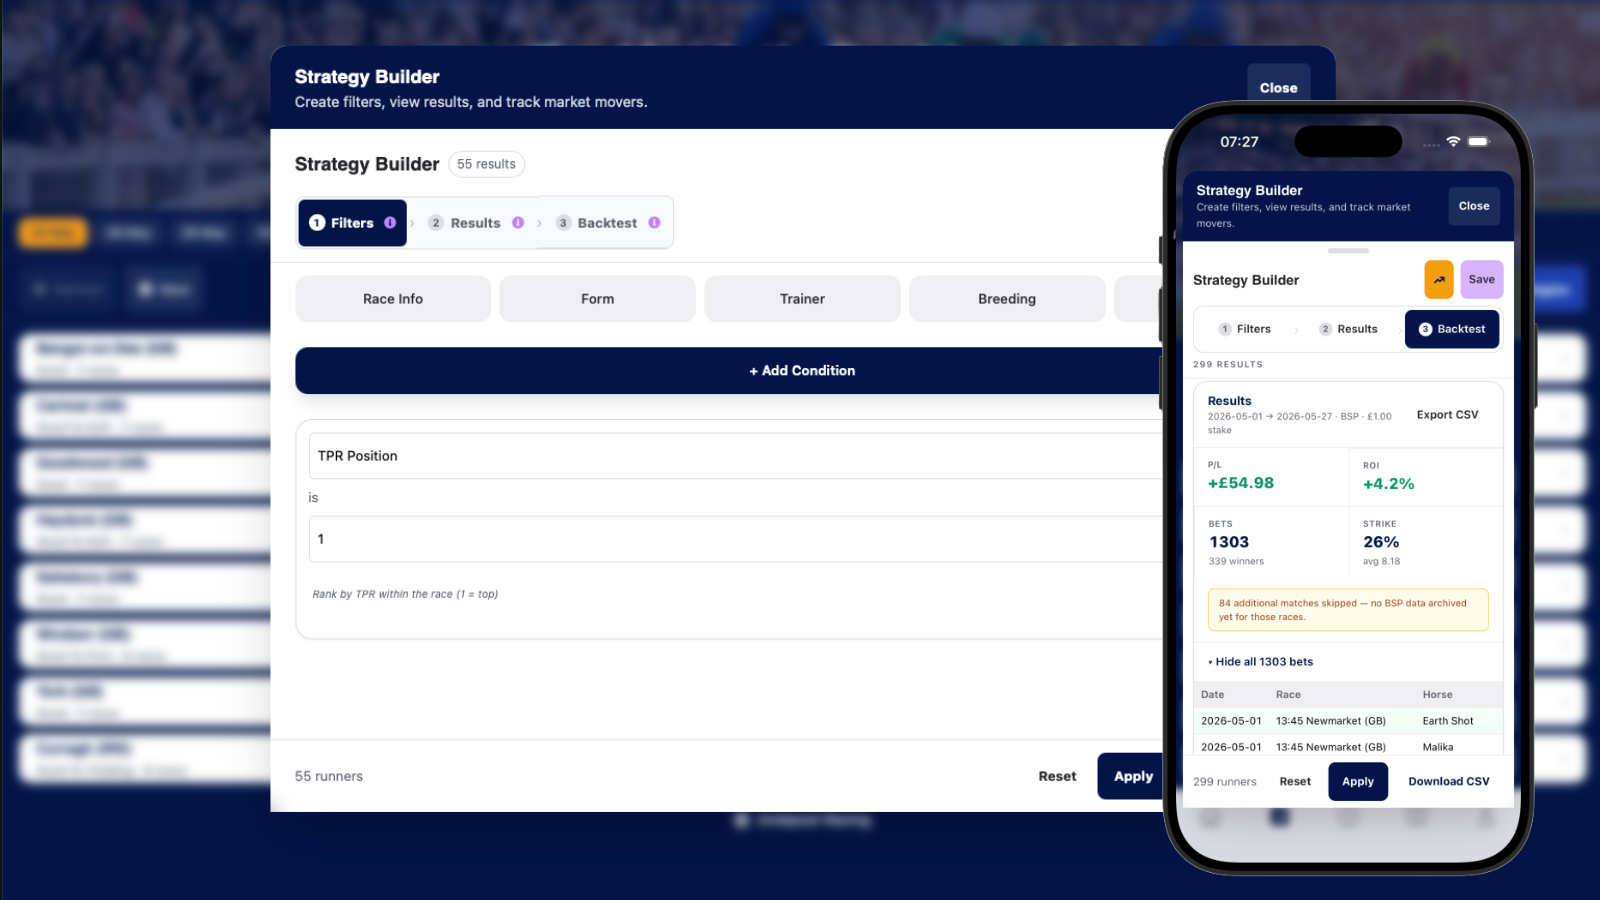
Build any filter strategy on the Filters tab, then move to the new Backtest tab. Pick a date range, choose SP or BSP, set your stake, and tap Run backtest. You get back the headline numbers every serious racing analyst cares about:
– Profit and loss in pounds
– Return on investment as a percentage
– Total qualifiers with winner count
– Strike rate with average winning odds
Toggle to see the full bet log. Every match dated, with price and P/L per row, winners highlighted. Export the whole log to CSV straight to Files, Mail, AirDrop, Google Drive or anywhere your phone supports, via the native iOS or Android share sheet.
A subtlety worth flagging. Betfair Starting Price often archives several hours after racing finishes. The Backtest engine distinguishes between “no matches found” and “matches found but BSP not yet archived for those races”, and tells you specifically which one you are seeing. That detail saves you from chasing a strategy that doesn’t exist when really you are just looking at last night’s runners.
Build a strategy, prove your edge on real history, then apply the validated approach to today’s card. The cycle is now closed.
Backtest Walkthrough
Want to see what Backtest actually does? Here is the simplest test you can run, end to end. It takes about five taps.
The strategy we are testing
One line: every horse that the model rates as TPR Position 1 (the top-rated runner in the race), with a 1-point stake at Betfair Starting Price.
There is nothing clever about this. No filter beyond “the top-rated horse, in every race”. It is the rawest possible measure of whether the model’s top pick alone produces a profit at BSP across months of historical racing. That answer is your baseline. Every clever filter you layer on top will be measured against it.
Step 1: open Strategies
From the home screen, tap the Strategies icon. The modal opens on the Filters tab by default.
Step 2: add the filter
Tap Add Condition. The field picker slides in. Scroll or search for TPR Position (it lives under the Form & speed bucket). Tap it.
The new filter row appears. Set the operator to equals and the value to 1.
(optional) Step 3: save the strategy
Tap Save and give it a name. Something like “TPR Pos 1” works.
Step 4: see the results
At the bottom of the screen, press Apply. This will take you directly to the Results tab where you will see a list of all horses that meet your filter (TPR top-rated) over the coming days.
Step 5: switch to the Backtest tab
The workflow rail at the top of the modal shows Filters → Results → Backtest. Tap Backtest.
Step 6: set the parameters
– Date range: pick the full available history (1 May 2026 onwards, or any subset you want)
– Price: select BSP (Betfair Starting Price)
– Stake: 1 (a 1-point stake per qualifier)
Step 7: tap Run backtest
The engine works through every race in your date range, finds the TPR Position 1 runner, and tracks the result at BSP. A few seconds later, your numbers are in.
Reading the result
You get four headline numbers, plus an average winning odds figure:
– Profit/Loss in £: your bank position versus starting flat
– ROI as a %: return per pound staked
– Total qualifiers: how many runners matched the strategy
– Strike rate: what percentage of those runners won
– Average winning odds: your typical winner’s price
Toggle the Show all … bets on. Every match shows the date, the race, the runner, the BSP, and the result. Winners are highlighted. Scroll through the day by day.
Where to go from here
This number is your baseline. From here, the interesting questions start. Each is another filter row in the same strategy:
– What if you require ClassDelta of -5 or better (the runner dropping in class)?
– What if you only count handicap races?
– What if the Going TPR has to be above a threshold?
– What if Trainer Strike Rate in the last 30 days has to be above a number?
Each new filter narrows the qualifier list. Run the backtest again and you can see whether the layered filter improved or degraded the baseline.
This is a long tail of fixes and improvements that make the app feel built rather than assembled.
If you are new to the app, the TPR is the easiest place to start. Open today’s racing, scan the field-relative colours, and you have an instant read on where the model sees the strongest signal.
If you have been using the Strategies modal before, the Filters tab is where the biggest change has happened. Browse the new buckets and read the hints under each field. Most of what you wanted from the previous version is still there, just better explained.
If you are ready to test something, build a strategy on Filters, save it, then go straight to Backtest. Pick a month, pick SP or BSP, and see what the data says. Open the app, head to Strategies → Backtest, and try it on a strategy you’ve been running in your head for months. The cycle is now closed.
More racedays, read by the data
Get the next raceday guide, free
Every big raceday we read the whole card with the model: ratings, speed figures, pace and draw. We send the next one to your inbox the morning it is published. No charge, and you can unsubscribe in one click.
We use your email to send racing guides and occasional news about EquiAnalytix. We never share it. 18+ | Please gamble responsibly.
Every runner, every race, every day
Everything this guide runs on, the percentages, the engine readings, the figures, the pace maps, lives on the dashboard for every British and Irish race. From 27p a day.
Explore the dashboard →EquiAnalytix provides horse racing data and analysis only. We do not take bets. 18+ | Please gamble responsibly. GamCare 0808 8020 133.